UpSet 多基因集排他交集图
GAL-0026
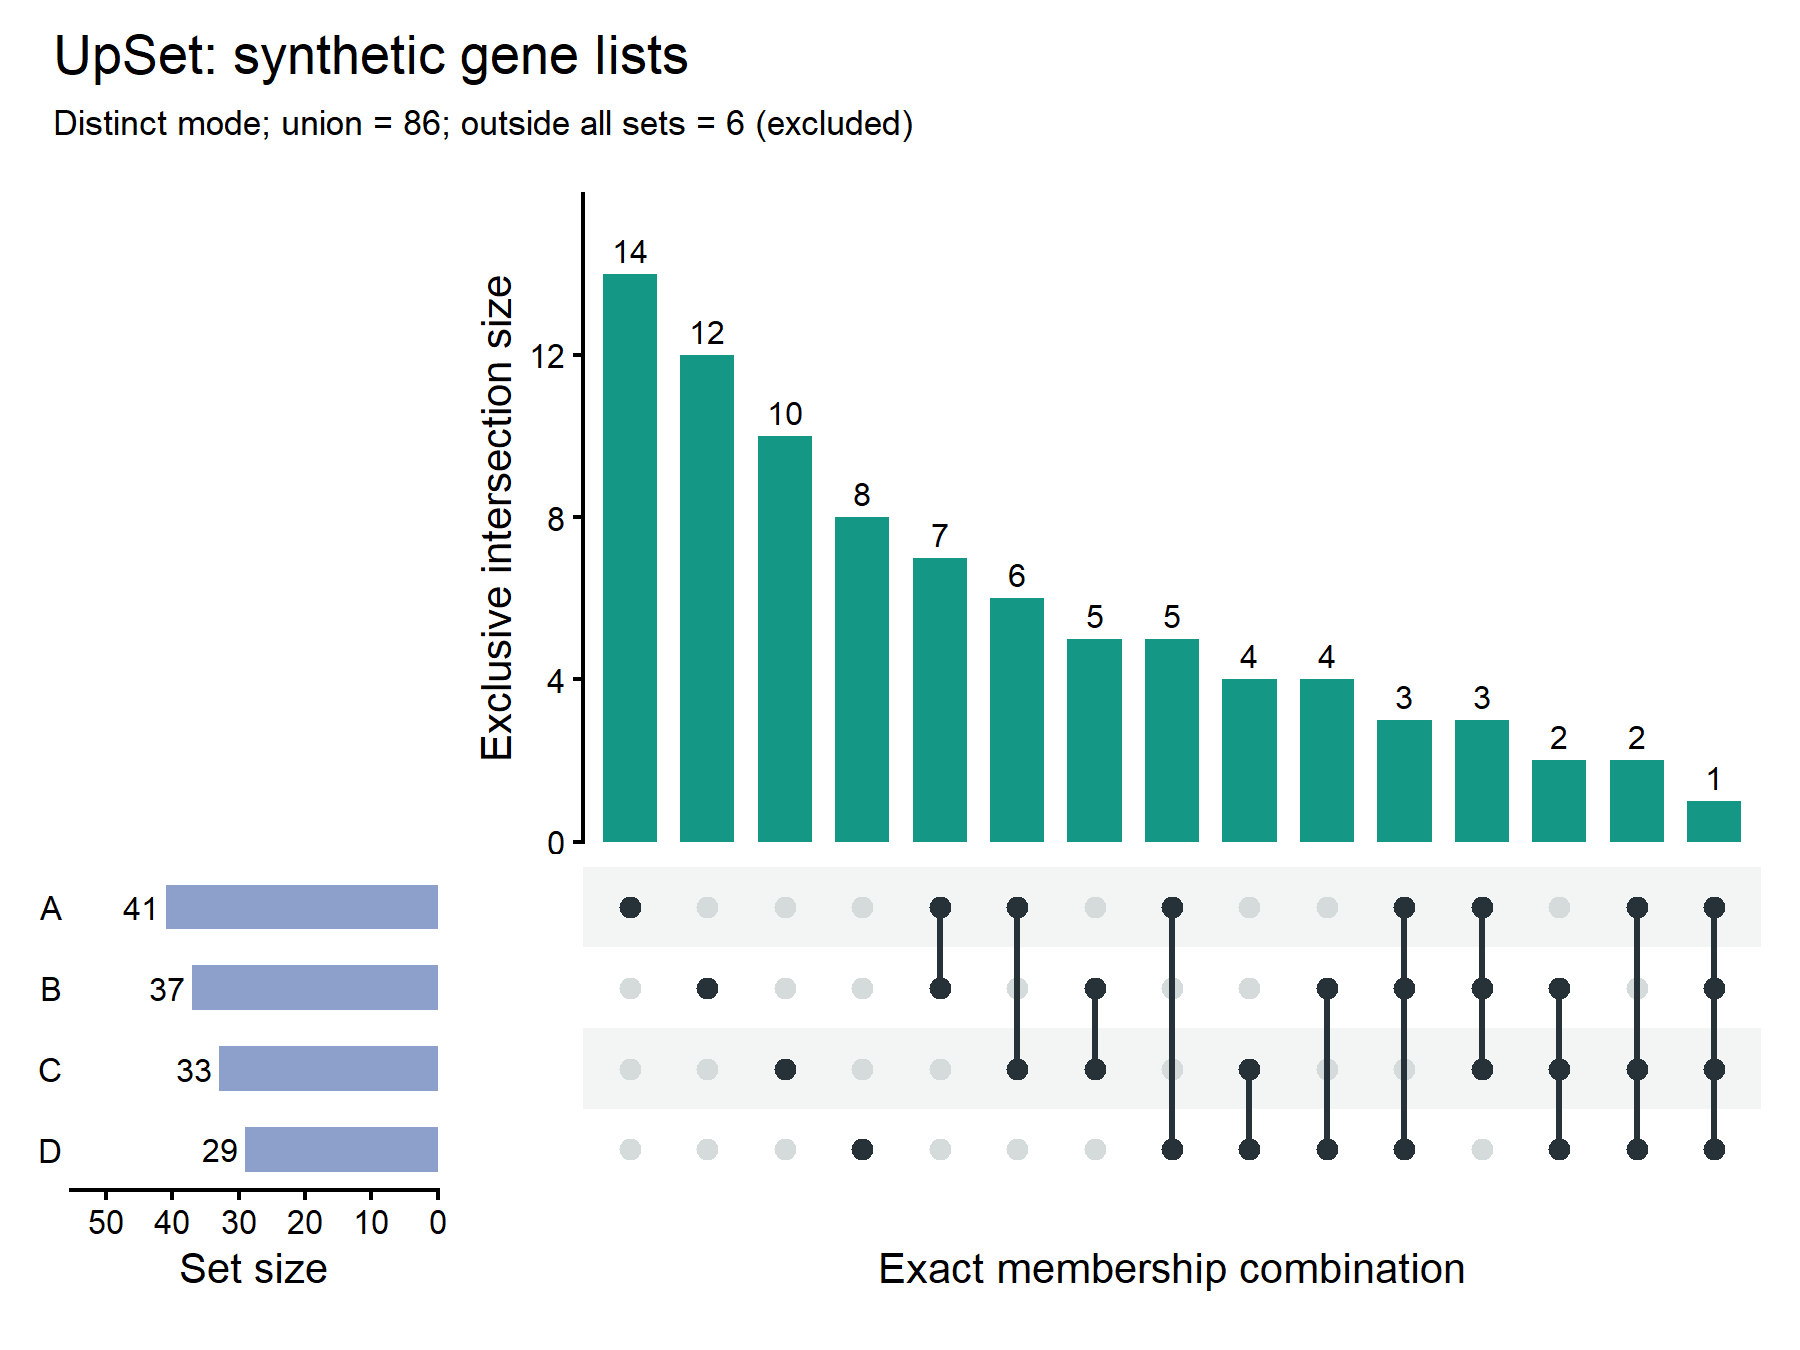
以四个模拟基因列表展示排他交集:上方柱表示每种精确集合组合的基因数,下方点阵说明哪些集合纳入、哪些排除,左侧条形表示每个集合的总大小。所有排他交集之和等于集合并集,而不属于任何集合的背景基因另行说明。
图与代码
code/R/main.R
suppressPackageStartupMessages(library(ggplot2))

exclusive_counts <- function(m) {
  stopifnot(all(m %in% c(0, 1)), !anyNA(m))
  code <- apply(m, 1, paste0, collapse = "")
  counts <- table(code[rowSums(m) > 0])
  d <- data.frame(code = names(counts), count = as.integer(counts))
  d[order(-d$count, d$code), ]
}
toy <- exclusive_counts(matrix(c(1, 0, 1, 1, 0, 1, 0, 0), ncol = 2, byrow = TRUE))
stopifnot(identical(toy$code, c("01", "10", "11")), all(toy$count == 1))

dir.create("outputs", showWarnings = FALSE)
d <- read.csv("data/membership.csv")
stopifnot(!anyDuplicated(d$gene))
sets <- c("A", "B", "C", "D")
m <- as.matrix(d[, sets])
tab <- exclusive_counts(m)
tab$x <- seq_len(nrow(tab))
union_n <- sum(rowSums(m) > 0)
outside_n <- sum(rowSums(m) == 0)
sizes <- colSums(m)
stopifnot(sum(tab$count) == union_n)
stats <- data.frame(key = c(paste0("intersection_", tab$code), paste0("set_", sets), "universe_n", "union_n", "outside_n"),
                    value = c(tab$count, sizes, nrow(m), union_n, outside_n))
write.csv(stats, "outputs/stats_r.csv", row.names = FALSE)
numbers <- lapply(seq_len(nrow(stats)), function(i) list(id = stats$key[i], value = stats$value[i],
  display = sprintf("%.0f", stats$value[i]), source = list(type = "computed", locator = "code/R/main.R")))
jsonlite::write_json(list(schema = "zzy-media-studio/numbers/v1", asset = "GAL-0026", numbers = numbers),
  "outputs/numbers.json", auto_unbox = TRUE, pretty = TRUE, digits = 16)
grid <- expand.grid(x = tab$x, y = 1:4)
grid$active <- as.integer(substr(tab$code[grid$x], grid$y, grid$y))
segments <- do.call(rbind, lapply(tab$x, function(i) {
  y <- which(strsplit(tab$code[i], "")[[1]] == "1")
  data.frame(x = i, y = min(y), yend = max(y))
}))
base <- theme_classic(base_size = 10) + theme(plot.margin = margin(3, 5, 3, 5))
top <- ggplot(tab, aes(x, count)) + geom_col(width = 0.7, fill = "#159785") +
  geom_text(aes(label = count), vjust = -0.5, size = 2.7) +
  scale_x_continuous(limits = c(0.4, nrow(tab) + 0.6), expand = c(0, 0)) +
  scale_y_continuous(expand = expansion(mult = c(0, 0.14))) +
  labs(x = NULL, y = "Exclusive intersection size") + base +
  theme(axis.text.x = element_blank(), axis.ticks.x = element_blank(), axis.line.x = element_blank())
matrix_plot <- ggplot(grid, aes(x, y)) +
  annotate("rect", xmin = -Inf, xmax = Inf, ymin = c(0.5, 2.5), ymax = c(1.5, 3.5), fill = "#F3F5F5") +
  geom_point(colour = "#D5DADA", size = 2.1) +
  geom_segment(data = segments, aes(xend = x, yend = yend), colour = "#263238", linewidth = 0.7) +
  geom_point(data = grid[grid$active == 1, ], colour = "#263238", size = 2.1) +
  scale_x_continuous(limits = c(0.4, nrow(tab) + 0.6), expand = c(0, 0), breaks = NULL) +
  scale_y_reverse(limits = c(4.5, 0.5), breaks = NULL, expand = c(0, 0)) +
  labs(x = "Exact membership combination", y = NULL) + base +
  theme(axis.line = element_blank(), axis.ticks = element_blank())
side <- ggplot(data.frame(y = 1:4, n = sizes), aes(n, y)) +
  geom_col(orientation = "y", width = 0.55, fill = "#8DA0CB") +
  geom_text(aes(label = n), hjust = 1.2, size = 2.7) +
  scale_x_reverse(limits = c(max(sizes) * 1.35, 0), expand = c(0, 0)) +
  scale_y_reverse(limits = c(4.5, 0.5), breaks = 1:4, labels = sets, expand = c(0, 0)) +
  labs(x = "Set size", y = NULL) + base +
  theme(axis.line.y = element_blank(), axis.ticks.y = element_blank())
png("outputs/figure_r.png", width = 6, height = 4.5, units = "in", res = 300, bg = "white")
top <- ggplotGrob(top); matrix_plot <- ggplotGrob(matrix_plot); side <- ggplotGrob(side)
widths <- grid::unit.pmax(top$widths, matrix_plot$widths)
top$widths <- matrix_plot$widths <- widths
heights <- grid::unit.pmax(matrix_plot$heights, side$heights)
matrix_plot$heights <- side$heights <- heights
grid::grid.newpage()
grid::grid.text("UpSet: synthetic gene lists", x = 0.03, y = 0.96, just = "left", gp = grid::gpar(fontsize = 13))
grid::grid.text(sprintf("Distinct mode; union = %d; outside all sets = %d (excluded)", union_n, outside_n),
                x = 0.03, y = 0.91, just = "left", gp = grid::gpar(fontsize = 8.5))
grid::pushViewport(grid::viewport(x = 0.5, y = 0.45, width = 0.98, height = 0.83,
  layout = grid::grid.layout(2, 2, widths = grid::unit(c(0.25, 0.75), "null"), heights = grid::unit(c(0.6, 0.4), "null"))))
grid::grid.draw(grid::editGrob(top, vp = grid::viewport(layout.pos.row = 1, layout.pos.col = 2)))
grid::grid.draw(grid::editGrob(matrix_plot, vp = grid::viewport(layout.pos.row = 2, layout.pos.col = 2)))
grid::grid.draw(grid::editGrob(side, vp = grid::viewport(layout.pos.row = 2, layout.pos.col = 1)))
dev.off()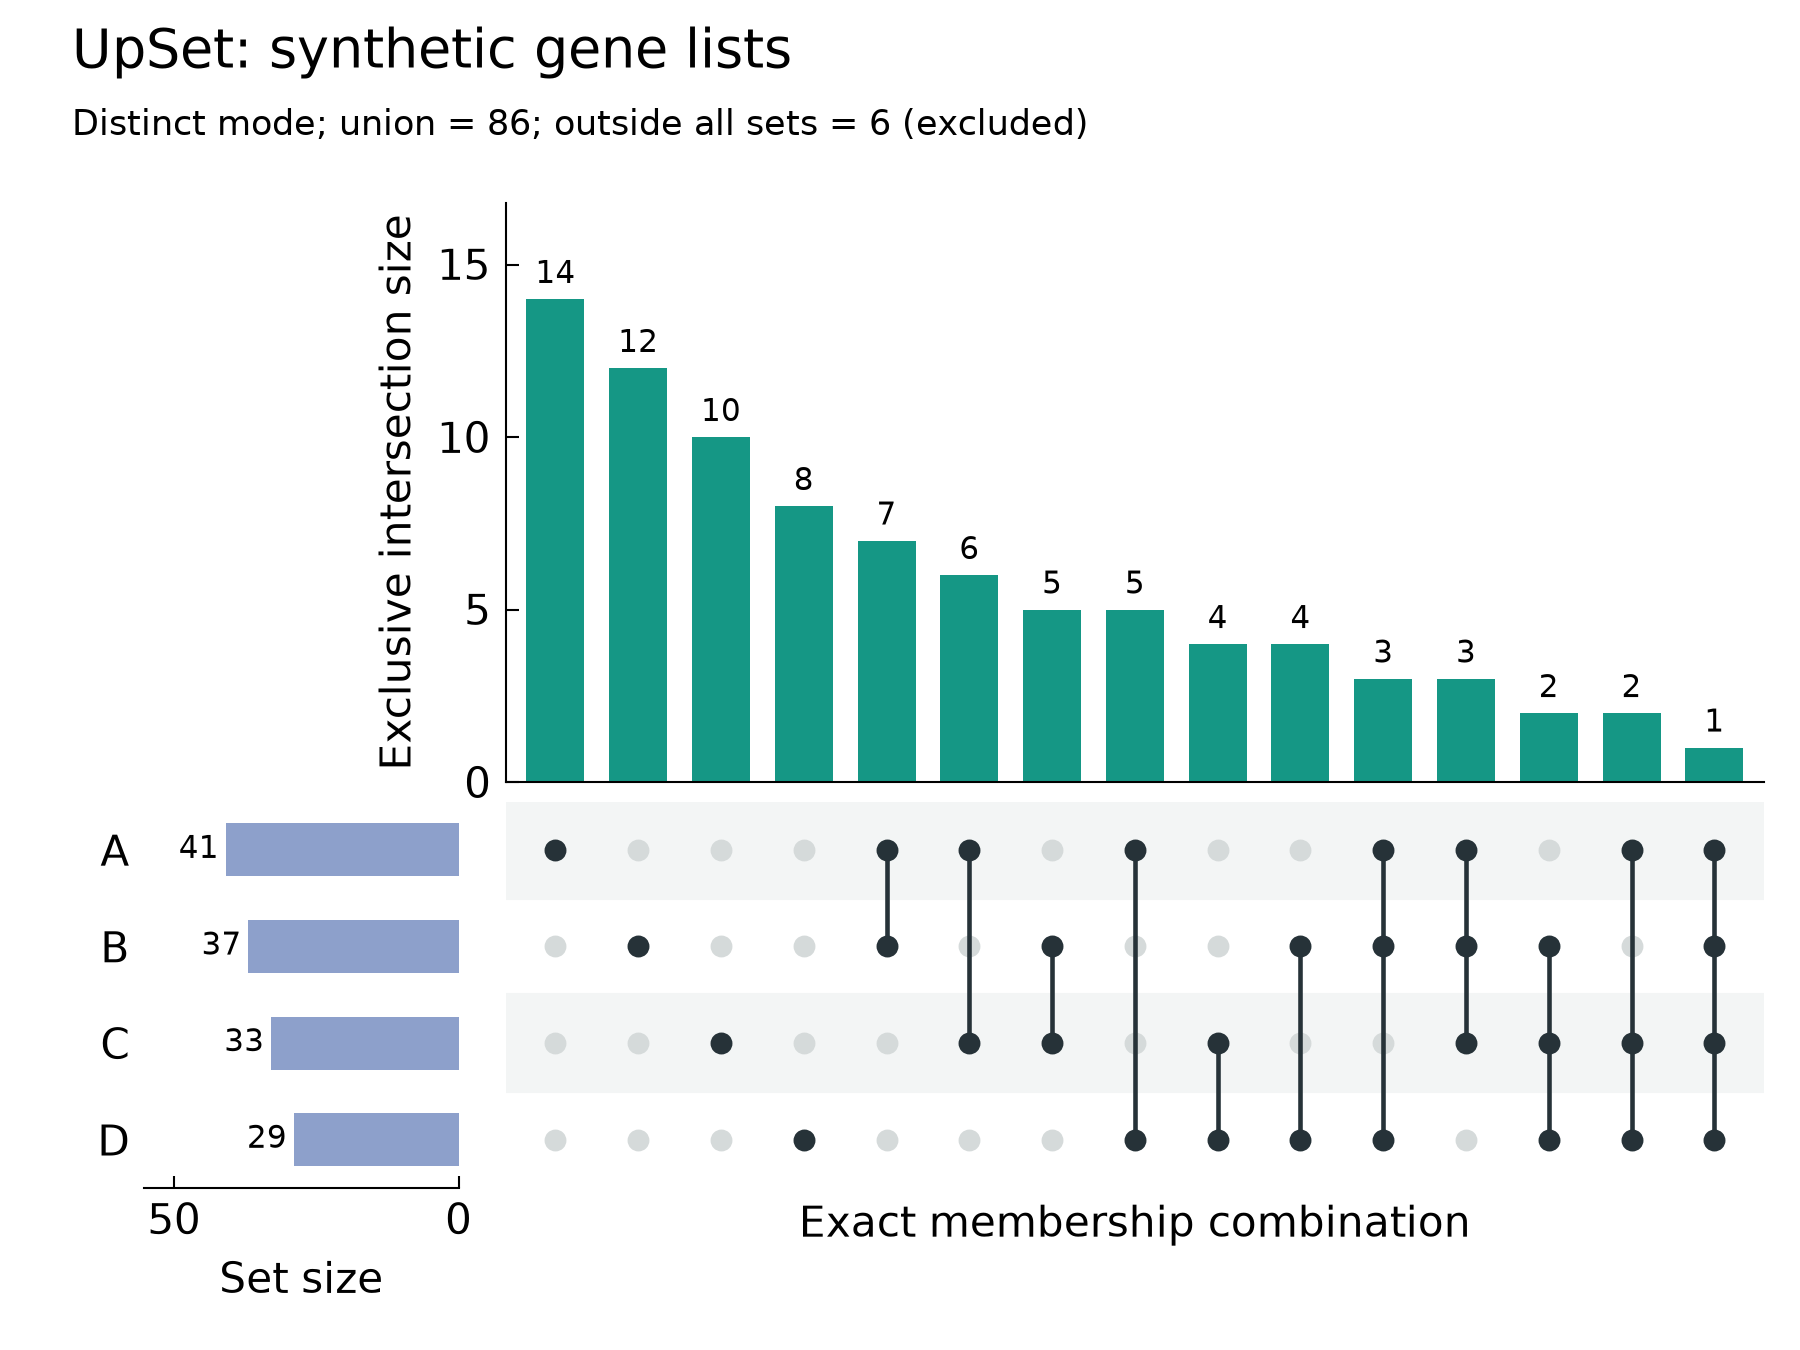
code/py/main.py
from pathlib import Path

import numpy as np
import pandas as pd
import matplotlib.pyplot as plt
import scienceplots  # noqa: F401


def exclusive_counts(matrix):
    matrix = np.asarray(matrix)
    if matrix.ndim != 2 or not np.isin(matrix, [0, 1]).all():
        raise ValueError("集合归属必须为二维0/1矩阵")
    codes = ["".join(str(int(v)) for v in row) for row in matrix if row.sum() > 0]
    counts = pd.Series(codes, dtype=str).value_counts()
    return sorted(((str(code), int(count)) for code, count in counts.items()), key=lambda x: (-x[1], x[0]))


def main():
    Path("outputs").mkdir(exist_ok=True)
    d = pd.read_csv("data/membership.csv")
    if d.gene.duplicated().any():
        raise ValueError("每个基因只能有一行")
    names = ["A", "B", "C", "D"]
    m = d[names].to_numpy()
    counts = exclusive_counts(m)
    codes, values = zip(*counts)
    sizes = m.sum(axis=0)
    union_n, outside_n = int((m.sum(axis=1) > 0).sum()), int((m.sum(axis=1) == 0).sum())
    assert sum(values) == union_n
    rows = [(f"intersection_{code}", n) for code, n in counts]
    rows += [(f"set_{name}", int(n)) for name, n in zip(names, sizes)]
    rows += [("universe_n", len(d)), ("union_n", union_n), ("outside_n", outside_n)]
    pd.DataFrame(rows, columns=["key", "value"]).to_csv("outputs/stats_py.csv", index=False)

    plt.style.use(["science", "no-latex"])
    plt.rcParams.update({"font.family": "sans-serif", "font.size": 10, "savefig.bbox": "standard"})
    fig = plt.figure(figsize=(6, 4.5))
    gs = fig.add_gridspec(2, 2, width_ratios=[1, 4], height_ratios=[3, 2], hspace=0.04, wspace=0.06)
    top, matrix_ax, side = fig.add_subplot(gs[0, 1]), fig.add_subplot(gs[1, 1]), fig.add_subplot(gs[1, 0])
    x = np.arange(len(counts))
    top.bar(x, values, width=0.7, color="#159785")
    for i, value in enumerate(values):
        top.text(i, value + 0.25, str(value), ha="center", va="bottom", fontsize=7.5)
    top.set(xlim=(-0.6, len(x) - 0.4), ylim=(0, max(values) * 1.2), ylabel="Exclusive intersection size", xticks=[])
    for y in [0, 2]:
        matrix_ax.axhspan(y - 0.5, y + 0.5, color="#F3F5F5", zorder=0)
    for i, code in enumerate(codes):
        matrix_ax.scatter([i] * 4, np.arange(4), color="#D5DADA", s=18, zorder=1)
        active = np.flatnonzero(np.array(list(code)) == "1")
        matrix_ax.plot([i, i], [active.min(), active.max()], color="#263238", lw=1.1, zorder=2)
        matrix_ax.scatter([i] * len(active), active, color="#263238", s=18, zorder=3)
    matrix_ax.set(xlim=(-0.6, len(x) - 0.4), ylim=(3.5, -0.5), xticks=[], yticks=[], xlabel="Exact membership combination")
    side.barh(np.arange(4), sizes, height=0.55, color="#8DA0CB")
    for y, n in enumerate(sizes):
        side.text(n + 1.2, y, str(n), ha="right", va="center", fontsize=7.5)
    side.set(ylim=(3.5, -0.5), xlim=(max(sizes) * 1.35, 0), yticks=np.arange(4), yticklabels=names, xlabel="Set size")
    side.tick_params(axis="y", length=0)
    for ax in (top, matrix_ax, side):
        ax.minorticks_off()
        ax.tick_params(top=False, right=False)
        ax.spines[["top", "right"]].set_visible(False)
    matrix_ax.spines[["bottom", "left"]].set_visible(False)
    side.spines["left"].set_visible(False)
    fig.text(0.04, 0.95, "UpSet: synthetic gene lists", fontsize=13)
    fig.text(0.04, 0.90, f"Distinct mode; union = {union_n}; outside all sets = {outside_n} (excluded)", fontsize=8.5)
    fig.subplots_adjust(left=0.08, right=0.98, bottom=0.12, top=0.85)
    fig.savefig("outputs/figure_py.png", dpi=300, facecolor="white")
    plt.close(fig)


if __name__ == "__main__":
    main()
什么时候用
- 比较多个差异基因列表的重合与特有部分
- 集合数较多、Venn 图难以清楚表达交集时
- 需要同时看各集合大小和具体组合交集大小时
常见误用
- 本例是排他交集:A和B的列也要求不属于未点亮的C/D;不等于通常允许同时属于C/D的包含式A∩B
- 模拟基因ID应先统一且每行唯一;真实分析须先解决同名、重复ID、不同物种或版本映射
- 背景全集为输入表的所有基因;四列全为0的基因不进入交集柱和集合并集,并在标题副注报告其数量
- 只画出现过的非空排他组合,按数量递减、再按组合编码升序排列;隐藏零计数组合不意味着所有可能组合都存在
数据与下载
数据:本项目原创模拟数据,由 code/R/make_data.R 固定种子 20261026 生成(CC0-1.0(本项目原创模拟教学数据))。membership.csv 每行一个模拟基因,A/B/C/D为0/1集合归属。预设多种排他组合后固定种子打乱行顺序,同时保留全0背景;没有使用真实论文基因名单。
下载包 sha256:5d1fefd009397476f46d00074cf8f56b0d509006cefaed60d4ecfb19b1b96a8c