PR曲线与平均精确率(不平衡结局)
GAL-0022
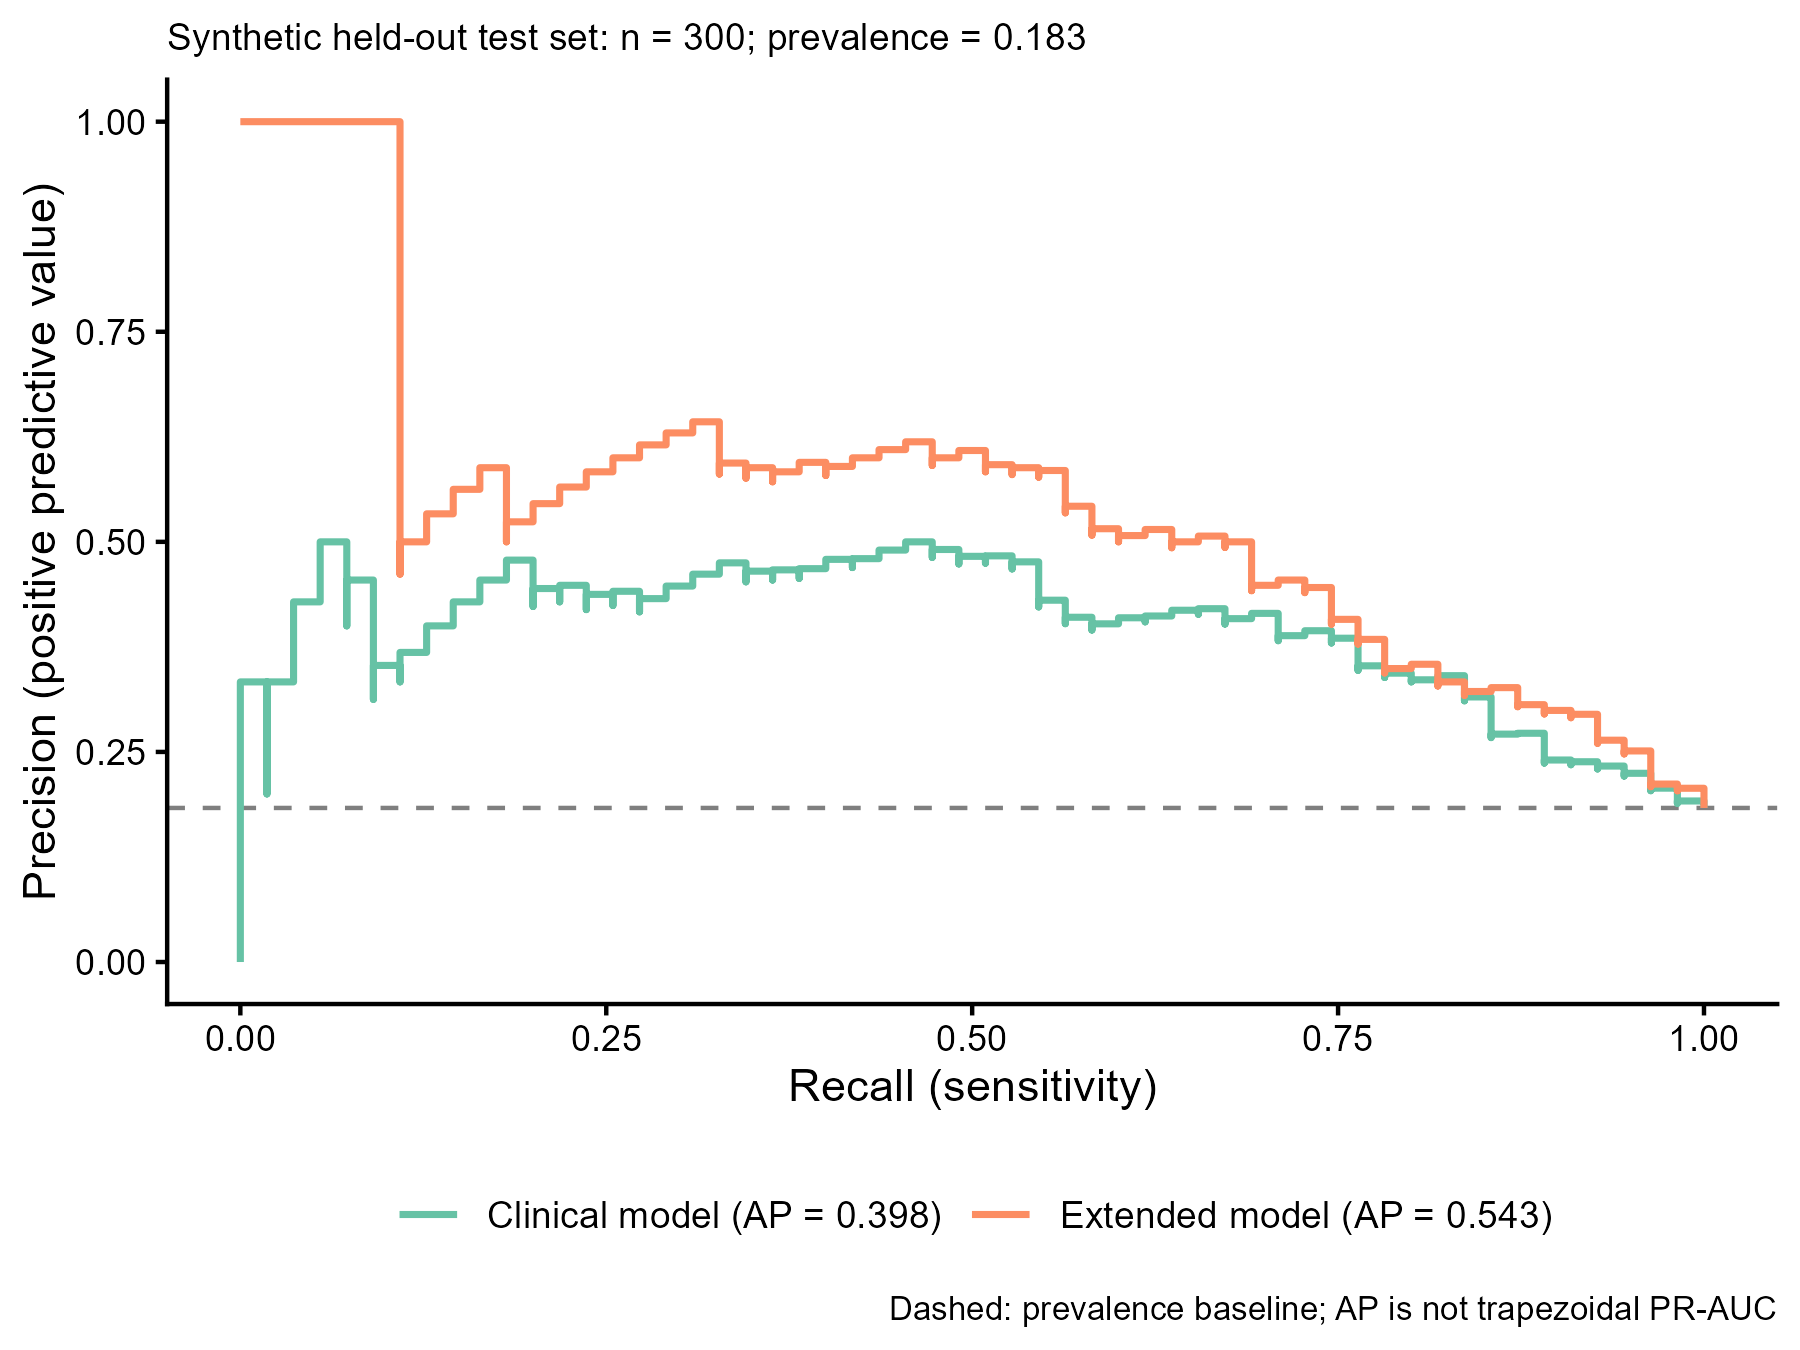
在独立模拟测试集上比较两个预先训练模型的精确率—召回率曲线,并计算平均精确率 AP。虚线为测试集阳性率,适合补充 ROC 评价不平衡结局。
图与代码
code/R/main.R
suppressPackageStartupMessages(library(ggplot2))
dir.create("outputs", showWarnings = FALSE)
pr_curve <- function(y, score) {
  stopifnot(length(y) == length(score), length(y) > 0, all(is.finite(score)),
            all(y %in% c(0, 1)), sum(y) > 0, sum(y) < length(y))
  cut <- sort(unique(score), decreasing = TRUE)
  tp <- vapply(cut, function(t) sum(y[score >= t]), numeric(1))
  fp <- vapply(cut, function(t) sum(1 - y[score >= t]), numeric(1))
  data.frame(threshold = cut, recall = tp / sum(y), precision = tp / (tp + fp))
}
ap <- function(c) sum(diff(c(0, c$recall)) * c$precision)
# 并列分数必须整组纳入,已知答案 AP = 7/12。
stopifnot(abs(ap(pr_curve(c(1, 0, 1, 0), c(.8, .8, .3, .1))) - 7/12) < 1e-12)
d <- read.csv("data/test_predictions.csv")
curves <- list(); steps <- list(); stats <- list()
for (nm in c("clinical", "extended")) {
  cc <- pr_curve(d$y, d[[nm]])
  cc$model <- nm
  curves[[nm]] <- cc
  steps[[nm]] <- data.frame(recall = as.vector(rbind(c(0, head(cc$recall, -1)), cc$recall)),
                           precision = rep(cc$precision, each = 2), model = nm)
  stats[[nm]] <- data.frame(key = paste0(nm, "_ap"), value = ap(cc))
}
cs <- do.call(rbind, curves)
st <- rbind(data.frame(key = c("n_test", "n_positive", "prevalence"),
                      value = c(nrow(d), sum(d$y), mean(d$y))), do.call(rbind, stats))
write.csv(cs, "outputs/curves_r.csv", row.names = FALSE)
write.csv(st, "outputs/stats_r.csv", row.names = FALSE)
labels <- sprintf("%s (AP = %.3f)", c("Clinical model", "Extended model"), st$value[4:5])
p <- ggplot(do.call(rbind, steps), aes(recall, precision, colour = model)) +
  geom_hline(yintercept = mean(d$y), linetype = "dashed", colour = "grey50", linewidth = .5) +
  geom_path(linewidth = .8) +
  scale_colour_manual(values = c(clinical = "#66C2A5", extended = "#FC8D62"), labels = labels, name = NULL) +
  scale_x_continuous(limits = c(0, 1), breaks = seq(0, 1, .25)) +
  scale_y_continuous(limits = c(0, 1), breaks = seq(0, 1, .25)) +
  labs(x = "Recall (sensitivity)", y = "Precision (positive predictive value)",
       subtitle = sprintf("Synthetic held-out test set: n = %d; prevalence = %.3f", nrow(d), mean(d$y)),
       caption = "Dashed: prevalence baseline; AP is not trapezoidal PR-AUC") +
  theme_classic(base_size = 11) + theme(legend.position = "bottom", legend.text = element_text(size = 9),
                                      plot.caption = element_text(size = 8), plot.subtitle = element_text(size = 9))
ggsave("outputs/figure_r.png", p, width = 6, height = 4.5, dpi = 300, bg = "white")

# 账本从本次计算的统计表生成,显示精度与图中标注一致。
ledger_stats <- read.csv("outputs/stats_r.csv")
ledger_numbers <- lapply(seq_len(nrow(ledger_stats)), function(i) {
  key <- ledger_stats$key[i]
  value <- ledger_stats$value[i]
  list(id = key, value = value,
       display = if (startsWith(key, "n_")) sprintf("%.0f", value) else sprintf("%.3f", value),
       source = list(type = "computed", locator = "code/R/main.R -> outputs/stats_r.csv"))
})
jsonlite::write_json(list(schema = "zzy-media-studio/numbers/v1", asset = "GAL-0022", numbers = ledger_numbers),
                     "outputs/numbers.json", auto_unbox = TRUE, pretty = TRUE, digits = 16)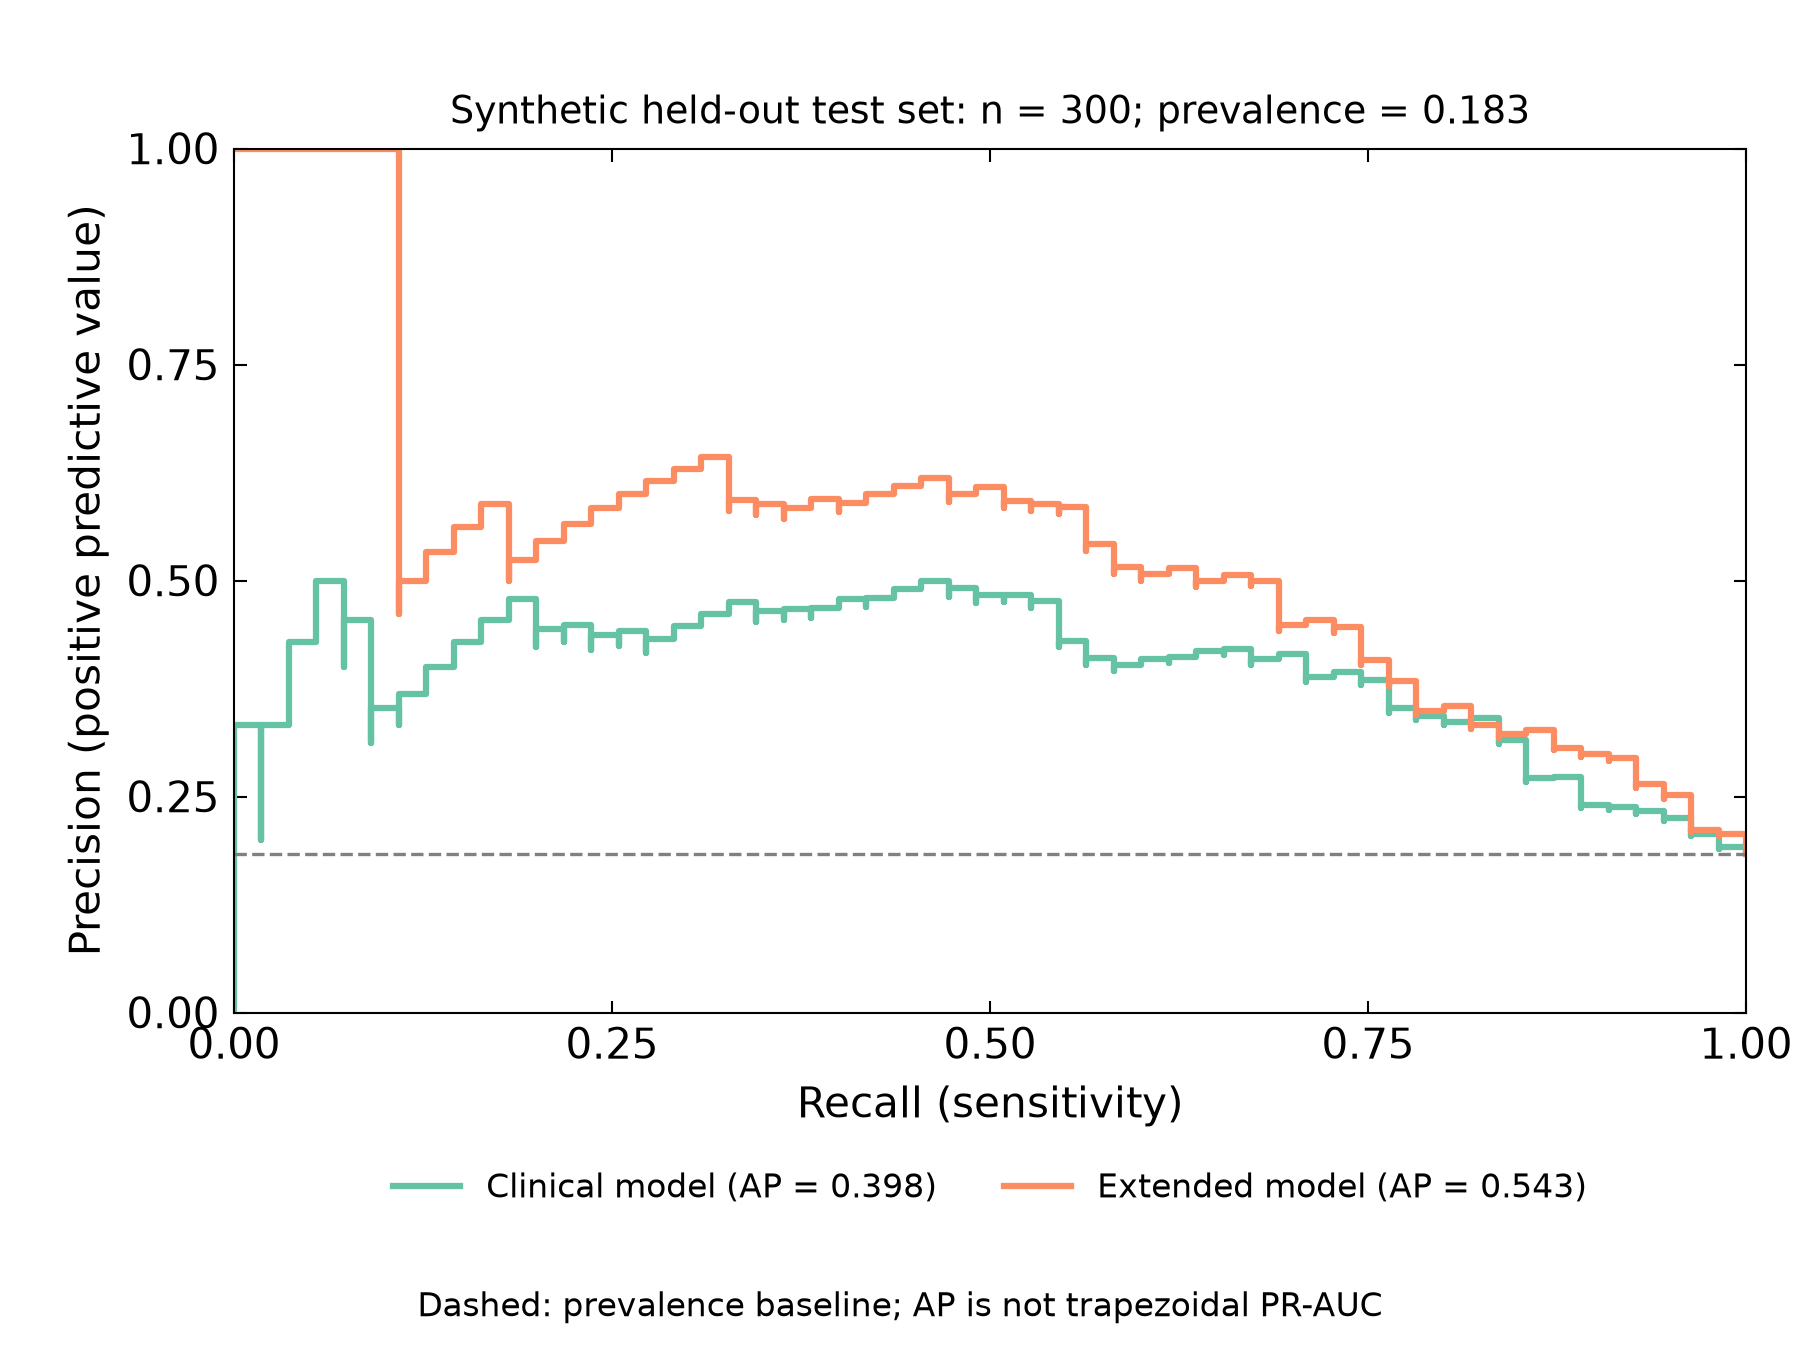
code/py/main.py
from pathlib import Path
import numpy as np
import pandas as pd
import matplotlib.pyplot as plt
import scienceplots

plt.style.use(["science", "no-latex"])
plt.rcParams["font.family"] = "sans-serif"
plt.rcParams["savefig.bbox"] = "standard"
from sklearn.metrics import precision_recall_curve, average_precision_score


def pr_curve(y, score):
    y, score = np.asarray(y), np.asarray(score)
    if len(y) == 0 or len(y) != len(score) or not np.isfinite(score).all() or not np.isin(y, [0, 1]).all() or y.sum() in (0, len(y)):
        raise ValueError("Need finite scores and both binary classes")
    precision, recall, thresholds = precision_recall_curve(y, score, drop_intermediate=False)
    return pd.DataFrame({"threshold": thresholds[::-1], "recall": recall[:-1][::-1], "precision": precision[:-1][::-1]})


def main():
    Path("outputs").mkdir(exist_ok=True)
    d = pd.read_csv("data/test_predictions.csv")
    fig, ax = plt.subplots(figsize=(6, 4.5))
    fig.subplots_adjust(left=.13, right=.97, bottom=.25, top=.89)
    curves = []
    rows = [("n_test", len(d)), ("n_positive", d.y.sum()), ("prevalence", d.y.mean())]
    for nm, label, col in [("clinical", "Clinical model", "#66C2A5"), ("extended", "Extended model", "#FC8D62")]:
        cc = pr_curve(d.y, d[nm])
        cc["model"] = nm
        curves.append(cc)
        ap = average_precision_score(d.y, d[nm])
        rows.append((f"{nm}_ap", ap))
        xx = np.column_stack([np.r_[0, cc.recall.to_numpy()[:-1]], cc.recall]).ravel()
        ax.plot(xx, np.repeat(cc.precision, 2), color=col, lw=1.5, label=f"{label} (AP = {ap:.3f})")
    ax.axhline(d.y.mean(), ls="--", color=".5", lw=.8)
    ax.set(xlim=(0, 1), ylim=(0, 1), xlabel="Recall (sensitivity)", ylabel="Precision (positive predictive value)")
    ax.set_xticks(np.arange(0, 1.01, .25)); ax.set_yticks(np.arange(0, 1.01, .25)); ax.minorticks_off()
    ax.set_title(f"Synthetic held-out test set: n = {len(d)}; prevalence = {d.y.mean():.3f}", fontsize=9)
    ax.legend(loc="upper center", bbox_to_anchor=(.5, -.15), ncol=2, frameon=False, fontsize=8)
    fig.text(.5, .025, "Dashed: prevalence baseline; AP is not trapezoidal PR-AUC", ha="center", fontsize=8)
    pd.concat(curves, ignore_index=True).to_csv("outputs/curves_py.csv", index=False)
    pd.DataFrame(rows, columns=["key", "value"]).to_csv("outputs/stats_py.csv", index=False)
    fig.savefig("outputs/figure_py.png", dpi=300, facecolor="white")
    plt.close(fig)


if __name__ == "__main__":
    main()
什么时候用
- 阳性结局较少,需要关心召回率和阳性预测值的权衡
- 比较相同测试集上的模型,作为 ROC/AUC 的补充
常见误用
- AP 按召回率增量加权精确率,不是梯形积分 PR-AUC;同分预测必须整组处理
- 阳性类别固定为 y=1;基线为当前测试集阳性率,患病率变化后精确率不可直接外推
- 本例模拟训练集 600、独立测试集 300;不在测试集拟合模型或选择最优阈值
- 数据是教学模拟,不代表真实患者或临床性能,图中未估计 AP 置信区间
数据与下载
数据:固定种子 20261026 的 R 原创模拟:逻辑回归训练集与测试集分离(原创模拟数据,CC0-1.0(教学用途,非真实患者))。make_data.R 生成 900 个对象,按生成顺序分为 600 个训练对象和 300 个独立测试对象;结局由预设逻辑概率抽样。训练 clinical(yx1)、extended(yx1+x2),冻结测试预测为四位小数(保留并列概率)。两语言仅从共享测试 CSV 独立计算 PR/AP;training.csv 保留生成与模型出处。main 可离线直接运行,无需重新生成数据。
下载包 sha256:fc3c1f9cd1360e818b45adee30983fe42e159479e75c4bd768e9b25f67d95d33