多模型 ROC 曲线(UCI Heart Disease)
FIG-0002
方法/版式参考:Jaeckle F, Gillett P, Kirkwood K, Natu S, Chan J, Bateman A, Arends M, Soilleux E. Generalisability of an adult-trained AI model to paediatric coeliac disease diagnosis: a multicentre external validation study. eClinicalMedicine 2026;101. DOI 10.1016/j.eclinm.2026.104246 DOI
这张图在讲什么
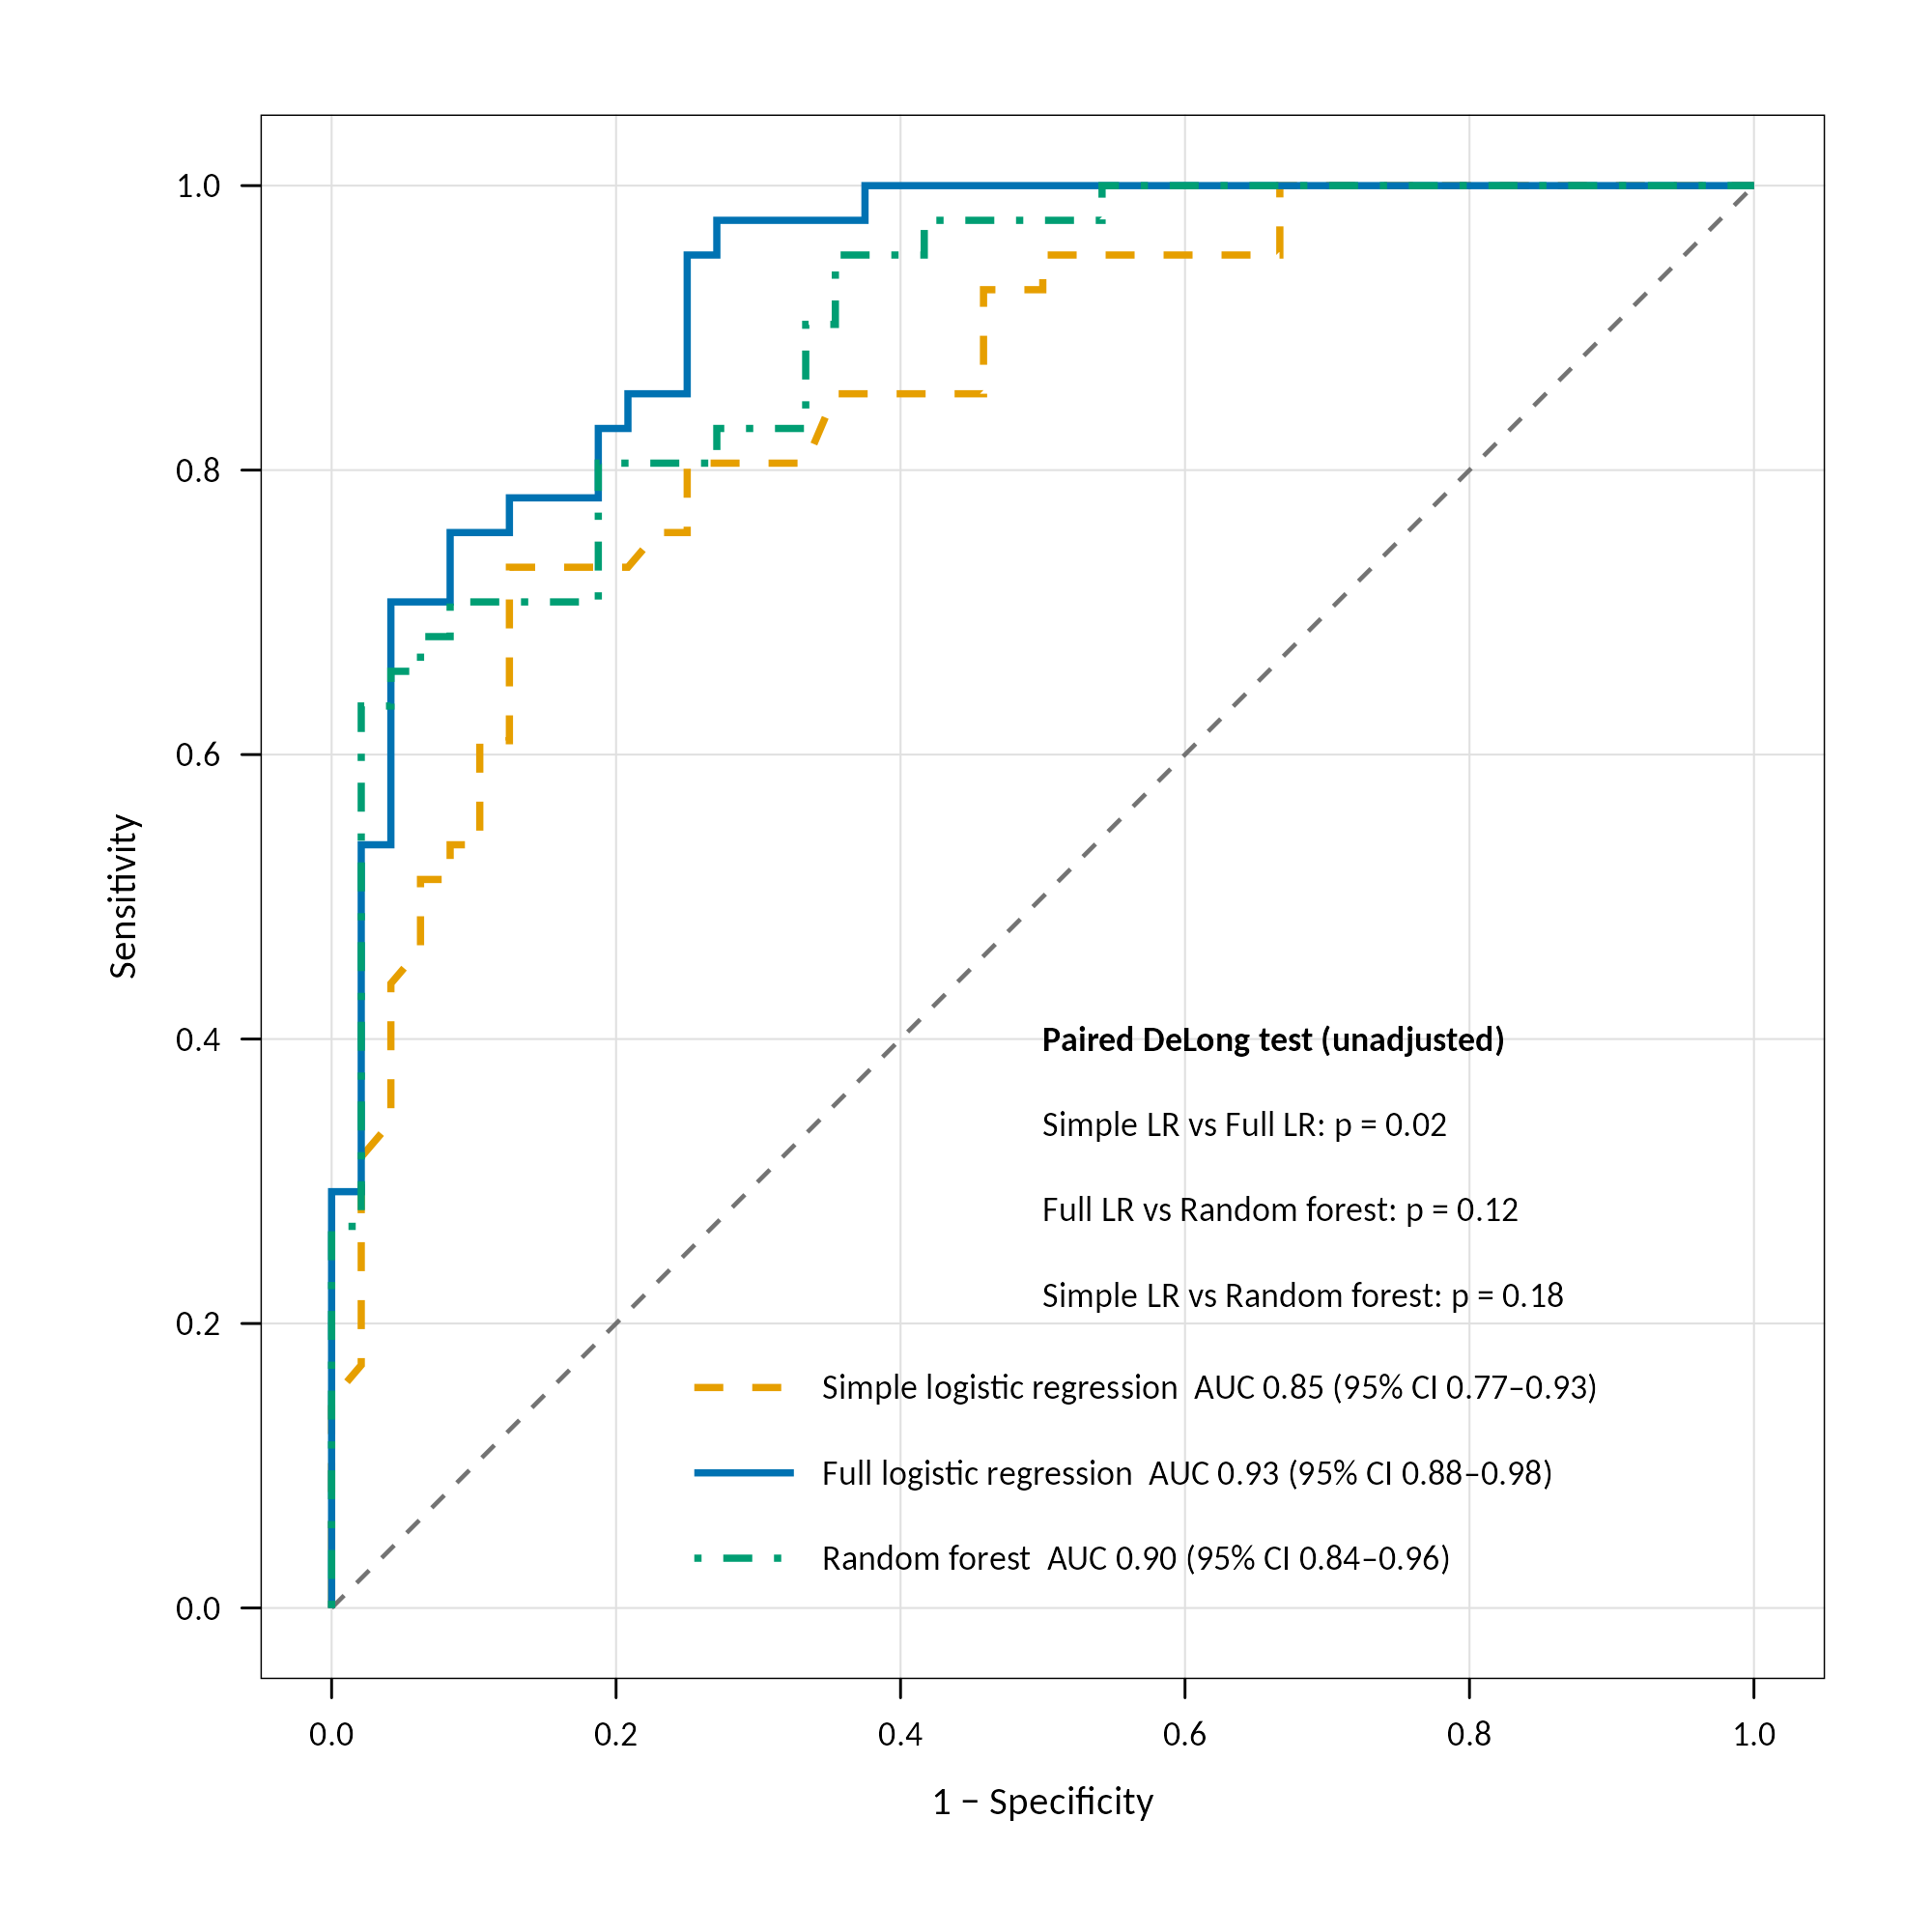
这张 ROC 图用公开的 UCI Heart Disease 数据,比较简单逻辑回归、完整逻辑回归和随机森林区分患病与未患病记录的能力。模型只在训练集拟合,曲线和图例中的 AUC 都来自同一批测试样本。
这是 L2 方法复现:用公开数据演示同类分析方法。没有使用参考论文的数据,也没有复现其结果;参考图像未取得,本图版式由本站自定。
怎么读
横轴为假阳性率(1 − 特异度),纵轴为敏感度。曲线越靠近左上角,表示在相同假阳性率下能识别更多阳性记录;对角虚线是随机判别的参照。图例中的 AUC 概括区分度,置信区间反映估计的不确定性。
本次读入 303 例,删去有缺失项的 6 例,保留 297 例完整病例;分层划分后训练集为 208 例,测试集为 89 例。以下结果均为测试集估计,95% 置信区间采用 DeLong 法。
| 模型 | AUC | 95% 置信区间 |
|---|---|---|
| 简单逻辑回归 | 0.85 | 0.77–0.93 |
| 完整逻辑回归 | 0.93 | 0.88–0.98 |
| 随机森林 | 0.90 | 0.84–0.96 |
完整逻辑回归在这次划分中的 AUC 点估计最高,不能据此认定它更优。图中 p 值来自 3 次配对 DeLong 检验,未作多重比较校正。例如简单与完整逻辑回归的未校正 p 值为 0.02,Holm 校正后为 0.07;校正后没有一对模型达到 0.05 的显著性水平。不显著也不等于已经证明模型等效。
数据与分析方法
- 数据与结局:使用 Cleveland 子集。原始
num > 0定义为阳性,对应冠脉造影显示任一主要血管直径狭窄超过 50%;num = 0为阴性。这只是本示例采用的数据标签,不是本站提出的诊断规则。 - 缺失与划分:将文件中的
?读为缺失,删除有缺失项的记录;按结局分层,以固定种子按训练集 70%、测试集 30% 的方案抽样。完整病例处理可能改变样本构成,不能因删除例数少就认定不存在选择偏差。 - 建模:简单逻辑回归使用
age、sex、cp;完整逻辑回归使用全部预测变量,并按代码预先指定的方式处理分类变量;随机森林使用ranger。不利用测试集筛选变量或调整参数。 - 评价与比较:在同一测试集计算经验 ROC、AUC 和 DeLong 区间。两两比较采用配对 DeLong 检验,另在账本中保留 Holm 校正结果。配对比较不能直接套到不同人群的 ROC 上。
需要注意什么
- 测试集较小,且主图来自一次随机划分。补充分析用 200 次固定种子的重复划分检查稳定性,模型排序会随划分改变;这不是独立外部验证,也不能把重叠的划分当作独立研究合并。
- 完整逻辑回归的参数数目为 18(不含截距),训练集每参数事件数为 5.3,提示估计不稳定及过拟合风险;这不是模型一定过拟合的证明。
- 训练集 AUC 通常可能偏乐观,但不是每个模型、每次划分都会高于测试集。本例简单逻辑回归的训练集 AUC 反而略低于测试集。
- AUC 只描述区分度,不回答预测概率是否校准,也不证明模型具有临床净获益。历史单中心公开数据的结果不能直接推广到当前就诊人群。
数据出处与许可
数据:Janosi A, Steinbrunn W, Pfisterer M, Detrano R. Heart Disease,UCI Machine Learning Repository,数据集 DOI,采用 CC BY 4.0。使用或再分发数据时请保留数据来源与署名。
方法思路参考:Jaeckle F 等,Generalisability of an adult-trained AI model to paediatric coeliac disease diagnosis: a multicentre external validation study,论文 DOI,PMID: 42903828。参考的是同批样本上比较多条 ROC 的方法思路;本页图像与数据均不是该论文的图像或数据。
本站代码采用 MIT 许可,教程文字与自制图形采用 CC BY-NC 4.0;数据、软件与字体分别按其原许可使用,详见下载包 LICENSE、provenance/license.md 和字体许可文件。
本资源仅为方法学教学,不构成医疗建议。
代码
规范实现
code/R/main.R
# FIG-0002 规范实现:多模型 ROC(UCI Heart Disease,Cleveland 子集,L2 方法复现)
# 方法依据 notes/design.md 与 notes/director_decision.md。只读 data/,只写 outputs/;
# 数字全部由代码算出并写进账本(只有 names_* / def_* 来自 heart-disease.names 的原文,由代码按行号解析)。
# 运行:python -m tools.figkit run FIG-0002
#
# 坐标:画布 2000 x 2000 像素(res = 200,即 10 x 10 英寸);几何信息一律以画布像素记录(左上角为原点)。

source(file.path(Sys.getenv("FIGKIT_LIB"), "figkit.R"))
source(file.path(fk_asset(), "code", "R", "pipeline.R"))
suppressPackageStartupMessages({ library(ggplot2); library(pROC); library(ranger) })

FONT <- fk_fonts()                          # FK-Carlito
MINUS <- "−"                           # 负号 U+2212
ENDASH <- "–"                          # 区间连接号
W <- 2000; H <- 2000; CANVAS <- c(W, H); RES <- 200

# ---- 版面常量(版面设计,不是数据) ----
PT_BASE <- 13; PT_TICK <- 13; PT_TITLE <- 15       # 字号(pt)
LWD_CURVE <- 3.6; LWD_DIAG <- 2.2; LWD_GRID <- 1; LWD_AXIS <- 1.4   # 线宽(R lwd 单位,1/96 英寸)
LEG_X0 <- 0.255; LEG_X1 <- 0.325; LEG_TX <- 0.345  # 图例线样、文字起点(数据坐标)
LEG_Y <- c(0.155, 0.095, 0.035)                    # 图例三行 y
ANN_X <- 0.50                                      # p 值块左端
ANN_Y <- c(0.40, 0.34, 0.28, 0.22)                 # 标题 + 三行 y
SENS_SEEDS <- 1001:1200                            # 敏感性分析的固定种子(不含 2026)
TICKS <- seq(0, 1, by = 0.2)
fs <- function(pt) pt / .pt

# 配色:Okabe–Ito(R 内置 palette.colors),取色并断言色值
oi <- palette.colors(palette = "Okabe-Ito", names = TRUE)
COL <- c(lr_simple = unname(oi["orange"]), lr_full = unname(oi["blue"]), rf = unname(oi["bluishgreen"]))
stopifnot(identical(unname(COL), c("#E69F00", "#0072B2", "#009E73")))
LTY <- c(lr_simple = "dashed", lr_full = "solid", rf = "dotdash")
MODEL_NAME <- c(lr_simple = "Simple logistic regression", lr_full = "Full logistic regression", rf = "Random forest")
PAIRS <- list(simple_full = c("lr_simple", "lr_full"), full_rf = c("lr_full", "rf"), simple_rf = c("lr_simple", "rf"))
PAIR_NAME <- c(simple_full = "Simple LR vs Full LR", full_rf = "Full LR vs Random forest",
               simple_rf = "Simple LR vs Random forest")

# ---- 显示格式 ----
fmt_dec <- function(x, k) { s <- sprintf(paste0("%.", k, "f"), x); sub("^-", MINUS, s) }
fmt2 <- function(x) fmt_dec(x, 2)
# p 值:>=0.01 取 2 位小数;[0.001, 0.01) 取 3 位;<0.001 显示 <0.001(value 留空,另设 _exact);舍入后为 1.00 显示 >0.99
fmt_p <- function(p) {
  if (p < 0.001) return(list(display = "<0.001", exact = TRUE))
  if (p < 0.01) return(list(display = sprintf("%.3f", p), exact = FALSE))
  s <- sprintf("%.2f", p)
  if (s == "1.00") return(list(display = ">0.99", exact = TRUE))
  list(display = s, exact = FALSE)
}
fmt_exact <- function(p) format(signif(p, 2), scientific = FALSE)
p_line <- function(disp) if (grepl("^[<>]", disp)) sprintf("p %s %s", substr(disp, 1, 1), substring(disp, 2)) else sprintf("p = %s", disp)

# ---- 账本助手 ----
LOC <- "code/R/main.R"
add <- function(id, value, display, group, label = NULL, src = LOC, type = "computed", ...) {
  fk_num(id, value, display, group = group, label = label, source_type = type, locator = src, ...)
}
add_int <- function(id, n, group, label, src = LOC, ...) add(id, n, as.character(n), group, label, src, unit = "例", ...)
add_p <- function(id, p, group, label, src = LOC) {
  f <- fmt_p(p)
  if (f$exact) {
    add(id, NA, f$display, group, label, src)
    add(paste0(id, "_exact"), p, fmt_exact(p), group, paste0(label, "(精确值)"), src)
  } else add(id, p, f$display, group, label, src)
  f$display
}
CI_AUC <- "95%(DeLong,pROC::ci.auc,代码计算)"
CI_DELTA <- "95%(Wald,自写 DeLong 协方差,代码计算)"

# ---- 数据 ----
d <- load_cleveland(fk_data())
nm <- read_names(fk_data())
cc <- complete_cases_prepared(d)
stopifnot(nrow(cc) == sum(stats::complete.cases(d[, VAR14])))
n_excl <- nrow(d) - nrow(cc)
stopifnot(identical(nm$num_dist[1:5], as.integer(tabulate(d$num + 1L, 5))))   # D2:读入分布 == names 第 242 行

# ---- 划分与建模(主分析,种子 2026) ----
sp <- split_stratified(cc$y, SEED_MAIN)
stopifnot(!anyDuplicated(c(sp$train, sp$test)), setequal(c(sp$train, sp$test), seq_len(nrow(cc))))
glm_warn <- character(0)
fp <- withCallingHandlers(fit_predict(cc, sp, SEED_MAIN, keep_fits = TRUE),
                          warning = function(w) { glm_warn <<- c(glm_warn, conditionMessage(w)) })
if (length(glm_warn)) cat("[glm 警告]", paste(unique(glm_warn), collapse = " | "), "\n")
y_te <- fp$y_test; y_tr <- fp$y_train
stopifnot(identical(y_te, cc$y[sp$test]))
for (f in names(cc)[vapply(cc, is.factor, NA)]) stopifnot(all(table(cc[[f]][sp$train]) > 0))    # D5

roc_te <- lapply(fp$test, function(p) roc_of(y_te, p))
stopifnot(identical(roc_te$lr_simple$response, roc_te$lr_full$response), identical(roc_te$lr_full$response, roc_te$rf$response))   # 三个模型用同一 response
roc_tr <- lapply(fp$train, function(p) roc_of(y_tr, p))
auc_te <- vapply(roc_te, function(r) as.numeric(pROC::auc(r)), 0)
auc_tr <- vapply(roc_tr, function(r) as.numeric(pROC::auc(r)), 0)
ci_te <- lapply(roc_te, function(r) as.numeric(pROC::ci.auc(r, conf.level = 0.95, method = "delong")))   # lo, auc, hi
se_te <- vapply(roc_te, function(r) sqrt(as.numeric(pROC::var(r, method = "delong"))), 0)
dl <- lapply(fp$test, function(p) delong_struct(p, y_te))
# pROC 的 CI 与未截断的 Wald 公式对照,记录是否被截断
ci_manual <- lapply(MODELS, function(m) auc_te[[m]] + c(-1, 1) * qnorm(0.975) * sqrt(delong_var(dl[[m]])))
names(ci_manual) <- MODELS
ci_trunc <- vapply(MODELS, function(m) !isTRUE(all.equal(c(ci_te[[m]][1], ci_te[[m]][3]), ci_manual[[m]], tolerance = 1e-10)), NA)
cat("[ci.auc] 与未截断 Wald 区间不同的模型:", if (any(ci_trunc)) paste(MODELS[ci_trunc], collapse = ", ") else "无", "\n")

pair_res <- lapply(PAIRS, function(pr) {
  rt <- pROC::roc.test(roc_te[[pr[1]]], roc_te[[pr[2]]], method = "delong", paired = TRUE)
  own <- delong_pair(dl[[pr[1]]], dl[[pr[2]]])
  stopifnot(abs(as.numeric(rt$statistic) - own$z) < 1e-8, abs(rt$p.value - own$p) < 1e-8)
  c(own, list(z_proot = as.numeric(rt$statistic), p_proot = rt$p.value))
})
p_raw <- vapply(pair_res, function(x) x$p_proot, 0)
p_holm <- p.adjust(p_raw, method = "holm")

# ---- 敏感性分析(总监决定:做;只进账本,不上主图) ----
sens <- matrix(NA_real_, nrow = length(SENS_SEEDS), ncol = 3, dimnames = list(NULL, MODELS))
n_sens_warn <- 0L
for (i in seq_along(SENS_SEEDS)) {
  s <- SENS_SEEDS[i]
  sp_s <- split_stratified(cc$y, s)
  r <- tryCatch(withCallingHandlers(fit_predict(cc, sp_s, s), warning = function(w) {
    n_sens_warn <<- n_sens_warn + 1L; invokeRestart("muffleWarning") }), error = function(e) NULL)
  if (!is.null(r)) sens[i, ] <- vapply(MODELS, function(m) as.numeric(pROC::auc(roc_of(r$y_test, r$test[[m]]))), 0)
}
n_sens_ok <- sum(stats::complete.cases(sens))
cat(sprintf("[敏感性] %d 个种子,成功 %d;glm 警告 %d 次(已按次数记录,未逐条输出)\n", length(SENS_SEEDS), n_sens_ok, n_sens_warn))
stopifnot(n_sens_ok > 0)

# ---- 数值账本 ----
n_pos_cc <- sum(cc$y == 1); n_neg_cc <- sum(cc$y == 0)
n_tr <- length(sp$train); n_te <- length(sp$test)
n_params <- length(stats::coef(fp$fits$lr_full)) - 1L
stopifnot(!anyNA(stats::coef(fp$fits$lr_full)))
NM_LOC <- function(r) sprintf("heart-disease.names 第 %d 行", r)

add_int("n_raw", nrow(d), "sample", "读入行数(Cleveland)")
add_int("n_missing_ca", sum(is.na(d$ca)), "sample", "ca 缺失行数")
add_int("n_missing_thal", sum(is.na(d$thal)), "sample", "thal 缺失行数")
add_int("n_excluded", n_excl, "sample", "至少缺一项被删去的行数")
add_int("n_complete", nrow(cc), "sample", "完整病例数")
add_int("n_complete_pos", n_pos_cc, "sample", "完整病例中阳性数")
add_int("n_complete_neg", n_neg_cc, "sample", "完整病例中阴性数")
add_int("n_train", n_tr, "sample", "训练集总数")
add_int("n_train_pos", sum(y_tr == 1), "sample", "训练集阳性数")
add_int("n_train_neg", sum(y_tr == 0), "sample", "训练集阴性数")
add_int("n_test", n_te, "sample", "测试集总数")
add_int("n_test_pos", sum(y_te == 1), "sample", "测试集阳性数")
add_int("n_test_neg", sum(y_te == 0), "sample", "测试集阴性数")
for (k in 0:4) {
  add_int(paste0("num_", k), sum(d$num == k), "sample", sprintf("读入数据中 num = %d 的例数", k))
  add_int(paste0("names_num_", k), nm$num_dist[k + 1], "names", sprintf("names 记载的 Cleveland num = %d 例数", k),
          src = NM_LOC(242), type = "original")
}
add_int("names_n_cleveland", nm$n_cleveland, "names", "names 记载的 Cleveland 例数", src = NM_LOC(102), type = "original")
add("def_stenosis_pct", nm$stenosis_pct, paste0(nm$stenosis_pct, "%"), "names", "结局定义:血管直径狭窄阈值",
    src = NM_LOC(216), type = "original", unit = "%")
add("data_license_version", 4.0, "4.0", "names", "数据许可版本号(CC BY 4.0)", src = "data/raw/SOURCE.json license 字段",
    type = "original")

add("design_outcome_cut", 0, "0", "design", "结局阈值:num > 0 为阳性")
add("design_train_frac", 100 * TRAIN_FRAC, sprintf("%d%%", round(100 * TRAIN_FRAC)), "design", "训练集比例", unit = "%")
add("design_test_frac", 100 * TEST_FRAC, sprintf("%d%%", round(100 * TEST_FRAC)), "design", "测试集比例", unit = "%")
add("design_ci_level", 95, "95%", "design", "置信水平", unit = "%")
add("design_n_pred_full", length(PRED_FULL), as.character(length(PRED_FULL)), "design", "完整模型预测变量数")
add("design_n_pred_simple", length(PRED_SIMPLE), as.character(length(PRED_SIMPLE)), "design", "简单模型预测变量数")
add("design_n_comparisons", length(PAIRS), as.character(length(PAIRS)), "design", "两两比较次数")
add("design_auc_chance", 0.5, "0.5", "design", "随机判别的 AUC")
add("design_alpha", 0.05, "0.05", "design", "显著性水平(双侧)")
add("rf_num_trees", RF_PARAMS$num.trees, as.character(RF_PARAMS$num.trees), "design", "随机森林树数")
add("rf_mtry", RF_PARAMS$mtry, as.character(RF_PARAMS$mtry), "design", "随机森林 mtry")
add("rf_min_node_size", RF_PARAMS$min.node.size, as.character(RF_PARAMS$min.node.size), "design", "随机森林 min.node.size")
add("lr_full_n_params", n_params, as.character(n_params), "design", "完整逻辑回归的参数个数(不含截距)")
add("lr_full_epv", sum(y_tr == 1) / n_params, fmt_dec(sum(y_tr == 1) / n_params, 1), "design", "完整逻辑回归的每变量事件数 EPV(训练集阳性数 ÷ 参数个数)")
for (v in TICKS) {
  add(paste0("tick_", gsub(".", "_", sprintf("%.1f", v), fixed = TRUE)), v, sprintf("%.1f", v), "axis", "坐标轴刻度")
}

for (m in MODELS) {
  add(paste0("auc_", m), auc_te[[m]], fmt2(auc_te[[m]]), "auc", paste0(MODEL_NAME[[m]], ":测试集 AUC"),
      lo = ci_te[[m]][1], hi = ci_te[[m]][3], lo_display = fmt2(ci_te[[m]][1]), hi_display = fmt2(ci_te[[m]][3]),
      ci_level = if (ci_trunc[[m]]) paste0(CI_AUC, ";pROC 已将区间截断到 [0, 1]") else CI_AUC)
  add(paste0("auc_se_", m), se_te[[m]], fmt_dec(se_te[[m]], 3), "auc", paste0(MODEL_NAME[[m]], ":AUC 的 DeLong 标准误"))
  add(paste0("auc_train_", m), auc_tr[[m]], fmt2(auc_tr[[m]]), "auc", paste0(MODEL_NAME[[m]], ":训练集上评价的 AUC(乐观偏差,不上图)"))
}
p_disp <- character(0)
for (nmp in names(PAIRS)) {
  r <- pair_res[[nmp]]
  lo <- r$delta - qnorm(0.975) * r$se; hi <- r$delta + qnorm(0.975) * r$se
  lab <- PAIR_NAME[[nmp]]
  add(paste0("delta_", nmp), r$delta, fmt2(r$delta), "delong", paste0(lab, ":AUC 差值(前者减后者)"),
      lo = lo, hi = hi, lo_display = fmt2(lo), hi_display = fmt2(hi), ci_level = CI_DELTA)
  add(paste0("z_", nmp), r$z, fmt2(r$z), "delong", paste0(lab, ":配对 DeLong Z"))
  p_disp[[nmp]] <- add_p(paste0("p_", nmp), p_raw[[nmp]], "delong", paste0(lab, ":未校正双侧 p"))
  add_p(paste0("p_holm_", nmp), p_holm[[nmp]], "delong", paste0(lab, ":Holm 校正 p(不上图)"))
}

add("sens_n_splits", length(SENS_SEEDS), as.character(length(SENS_SEEDS)), "sens", "敏感性分析:重复划分次数(固定种子)")
add("sens_n_valid", n_sens_ok, as.character(n_sens_ok), "sens", "敏感性分析:成功完成的划分次数")
ok_s <- stats::complete.cases(sens)
frac_rf_above_full <- mean(sens[ok_s, "rf"] > sens[ok_s, "lr_full"])      # 重复划分中随机森林测试集 AUC 高于完整 LR 的比例(并列不计)
add("sens_frac_rf_above_full", frac_rf_above_full, fmt2(frac_rf_above_full), "sens", "重复划分中随机森林测试集 AUC 高于完整逻辑回归的比例")
for (m in MODELS) {
  v <- sens[stats::complete.cases(sens), m]
  q <- stats::quantile(v, c(0.025, 0.5, 0.975), type = 7, names = FALSE)
  nm_m <- MODEL_NAME[[m]]
  add(paste0("sens_auc_", m, "_median"), q[2], fmt2(q[2]), "sens", paste0(nm_m, ":重复划分测试集 AUC 中位数"))
  add(paste0("sens_auc_", m, "_p2_5"), q[1], fmt2(q[1]), "sens", paste0(nm_m, ":重复划分测试集 AUC 2.5% 分位"))
  add(paste0("sens_auc_", m, "_p97_5"), q[3], fmt2(q[3]), "sens", paste0(nm_m, ":重复划分测试集 AUC 97.5% 分位"))
  add(paste0("sens_auc_", m, "_min"), min(v), fmt2(min(v)), "sens", paste0(nm_m, ":重复划分测试集 AUC 最小值"))
  add(paste0("sens_auc_", m, "_max"), max(v), fmt2(max(v)), "sens", paste0(nm_m, ":重复划分测试集 AUC 最大值"))
}

# ---- 图中文字(全部由账本显示值拼接) ----
led <- function(id) .fk$ledger[[id]]
ci_disp <- led("design_ci_level")$display
legend_txt <- vapply(MODELS, function(m) {
  e <- led(paste0("auc_", m))
  sprintf("%s  AUC %s (%s CI %s%s%s)", MODEL_NAME[[m]], e$display, ci_disp, e$lo_display, ENDASH, e$hi_display)
}, "")
annot_title <- "Paired DeLong test (unadjusted)"
annot_txt <- vapply(names(PAIRS), function(k) sprintf("%s: %s", PAIR_NAME[[k]], p_line(p_disp[[k]])), "")
fig_texts <- c(
  list(list(id = "axis_x_title", layer = "axes", text = paste0("1 ", MINUS, " Specificity"), ledger = list())),
  list(list(id = "axis_y_title", layer = "axes", text = "Sensitivity", ledger = list())),
  lapply(TICKS, function(v) list(id = paste0("tick_", gsub(".", "_", sprintf("%.1f", v), fixed = TRUE)), layer = "axes",
                                 text = sprintf("%.1f", v), ledger = list(paste0("tick_", gsub(".", "_", sprintf("%.1f", v), fixed = TRUE))))),
  lapply(MODELS, function(m) list(id = paste0("legend_", m), layer = "legend", text = unname(legend_txt[[m]]),
                                  ledger = list(paste0("auc_", m)))),
  list(list(id = "annot_title", layer = "annot", text = annot_title, ledger = list())),
  lapply(names(PAIRS), function(k) list(id = paste0("annot_", k), layer = "annot", text = unname(annot_txt[[k]]),
                                        ledger = list(paste0("p_", k)))))

# ---- 图 ----
curve_df <- lapply(roc_te, function(r) {
  x <- rev(1 - r$specificities); y <- rev(r$sensitivities)        # pROC 按阈值升序存储:反转后为 (0,0) -> (1,1)
  stopifnot(!is.unsorted(x), !is.unsorted(y), x[1] == 0, y[1] == 0, x[length(x)] == 1, y[length(y)] == 1)
  data.frame(x = x, y = y)
})
# 经验 ROC 作为 FPR 的函数:逐段取该 x 处的最高 y(竖直段取上沿,斜线段线性插值)
roc_upper <- function(df, xq) vapply(xq, function(q) {
  best <- -Inf
  for (i in seq_len(nrow(df) - 1)) {
    x1 <- df$x[i]; x2 <- df$x[i + 1]; y1 <- df$y[i]; y2 <- df$y[i + 1]
    if (q < x1 - 1e-12 || q > x2 + 1e-12) next
    best <- max(best, if (x2 - x1 < 1e-12) max(y1, y2) else y1 + (y2 - y1) * (q - x1) / (x2 - x1))
  }
  best
}, 0)

theme_fk <- function(show) {
  cl <- function(c) if (show) c else "transparent"
  theme_void(base_family = FONT) + theme(
    axis.text.x = element_text(colour = cl("black"), size = PT_TICK, family = FONT, margin = margin(t = 8)),
    axis.text.y = element_text(colour = cl("black"), size = PT_TICK, family = FONT, margin = margin(r = 8)),
    axis.title.x = element_text(colour = cl("black"), size = PT_TITLE, family = FONT, margin = margin(t = 14)),
    axis.title.y = element_text(colour = cl("black"), size = PT_TITLE, family = FONT, angle = 90, margin = margin(r = 14)),
    axis.ticks = element_line(colour = cl("black"), linewidth = LWD_AXIS / .pt),
    axis.ticks.length = unit(7, "pt"),
    panel.grid.major = element_line(colour = cl("grey88"), linewidth = LWD_GRID / .pt),
    panel.border = element_rect(colour = cl("black"), fill = NA, linewidth = LWD_AXIS / .pt),
    plot.margin = margin(40, 40, 40, 40, "pt"),
    plot.background = element_blank(), panel.background = element_blank())
}

curve_layer <- function(m) function() list(
  geom_path(data = curve_df[[m]], aes(x = x, y = y), colour = COL[[m]], linetype = LTY[[m]],
            linewidth = LWD_CURVE / .pt, lineend = "butt", linejoin = "mitre"))
layer_parts <- list(
  axes = function() list(),
  diagonal = function() list(
    annotate("segment", x = 0, xend = 1, y = 0, yend = 1, colour = "grey45", linetype = "dashed", linewidth = LWD_DIAG / .pt)),
  curve_lr_simple = curve_layer("lr_simple"), curve_lr_full = curve_layer("lr_full"), curve_rf = curve_layer("rf"),
  legend = function() c(
    lapply(seq_along(MODELS), function(i) annotate("segment", x = LEG_X0, xend = LEG_X1, y = LEG_Y[i], yend = LEG_Y[i],
                                                   colour = COL[[MODELS[i]]], linetype = LTY[[MODELS[i]]],
                                                   linewidth = LWD_CURVE / .pt)),
    lapply(seq_along(MODELS), function(i) annotate("text", x = LEG_TX, y = LEG_Y[i], label = legend_txt[[i]], hjust = 0,
                                                   size = fs(PT_BASE), family = FONT))),
  annot = function() c(
    list(annotate("text", x = ANN_X, y = ANN_Y[1], label = annot_title, hjust = 0, size = fs(PT_BASE), family = FONT, fontface = "bold")),
    lapply(seq_along(PAIRS), function(i) annotate("text", x = ANN_X, y = ANN_Y[i + 1], label = annot_txt[[i]], hjust = 0,
                                                  size = fs(PT_BASE), family = FONT))))
LAYERS <- names(layer_parts)

text_box_px <- function(label, pt, x_px, y_px, face = "plain") {     # 左对齐、垂直居中的文字包围盒(画布像素)
  g <- grid::textGrob(label, gp = grid::gpar(fontfamily = FONT, fontsize = pt, fontface = face))
  w <- grid::convertWidth(grid::grobWidth(g), "inches", valueOnly = TRUE) * RES
  h <- grid::convertHeight(grid::grobHeight(g), "inches", valueOnly = TRUE) * RES
  c(x0 = x_px, y0 = y_px - h / 2, x1 = x_px + w, y1 = y_px + h / 2)
}
geom_done <- FALSE

record_geometry <- function(p) {
  pb <- ggplot_build(p)
  px <- function(x, y) fk_gg_px(pb, x, y, CANVAS, RES)
  pn <- px(c(0, 1), c(0, 1))
  fk_geom("panel_box", "box", "axes", x0 = pn$x[1], y0 = pn$y[2], x1 = pn$x[2], y1 = pn$y[1])
  for (v in TICKS) {
    id <- gsub(".", "_", sprintf("%.1f", v), fixed = TRUE)
    a <- px(c(v, 0), c(0, v))
    fk_geom(paste0("tick_x_", id), "point", "axes", x = a$x[1], y = a$y[1], num = paste0("tick_", id))
    fk_geom(paste0("tick_y_", id), "point", "axes", x = a$x[2], y = a$y[2], num = paste0("tick_", id))
  }
  dg <- px(c(0, 1), c(0, 1))
  fk_geom("diagonal", "segment", "diagonal", x1 = dg$x[1], y1 = dg$y[1], x2 = dg$x[2], y2 = dg$y[2])
  xq <- seq(0, 1, length.out = 21)                                   # 约 20 个等距采样点(1 - 特异度)
  full_px <- list()
  for (m in MODELS) {
    cp <- px(xq, roc_upper(curve_df[[m]], xq))
    fk_geom(paste0("curve_", m), "polyline", paste0("curve_", m), x = cp$x, y = cp$y, num = paste0("auc_", m))
    full_px[[m]] <- px(curve_df[[m]]$x, curve_df[[m]]$y)
  }
  boxes <- list()
  for (i in seq_along(MODELS)) {
    m <- MODELS[i]
    k <- px(c(LEG_X0, LEG_X1, LEG_TX), rep(LEG_Y[i], 3))
    fk_geom(paste0("legend_key_", m), "segment", "legend", x1 = k$x[1], y1 = k$y[1], x2 = k$x[2], y2 = k$y[2], num = paste0("auc_", m))
    b <- text_box_px(legend_txt[[i]], PT_BASE, k$x[3], k$y[3])
    fk_geom(paste0("legend_", m), "box", "legend", x0 = b[["x0"]], y0 = b[["y0"]], x1 = b[["x1"]], y1 = b[["y1"]], num = paste0("auc_", m))
    boxes[[paste0("legend_", m)]] <- b
  }
  a0 <- px(rep(ANN_X, 4), ANN_Y)
  b <- text_box_px(annot_title, PT_BASE, a0$x[1], a0$y[1], face = "bold")
  fk_geom("annot_title", "box", "annot", x0 = b[["x0"]], y0 = b[["y0"]], x1 = b[["x1"]], y1 = b[["y1"]])
  boxes$annot_title <- b
  for (i in seq_along(PAIRS)) {
    k <- names(PAIRS)[i]
    b <- text_box_px(annot_txt[[i]], PT_BASE, a0$x[i + 1], a0$y[i + 1])
    fk_geom(paste0("annot_", k), "box", "annot", x0 = b[["x0"]], y0 = b[["y0"]], x1 = b[["x1"]], y1 = b[["y1"]], num = paste0("p_", k))
    boxes[[paste0("annot_", k)]] <- b
  }
  # 版面检查:文字不超出绘图区右缘;文字块不与曲线(完整折线)、对角线重叠;文字块之间不重叠
  pad <- 12
  for (nmb in names(boxes)) {
    b <- boxes[[nmb]]
    if (b[["x1"]] > pn$x[2] - 6) stop(sprintf("版面检查失败:%s 超出绘图区右缘(%.0f > %.0f)", nmb, b[["x1"]], pn$x[2]))
    for (m in MODELS) {
      cpx <- full_px[[m]]
      xs <- unlist(mapply(function(i) seq(cpx$x[i], cpx$x[i + 1], length.out = 50), seq_len(nrow(cpx) - 1), SIMPLIFY = FALSE))
      ys <- unlist(mapply(function(i) seq(cpx$y[i], cpx$y[i + 1], length.out = 50), seq_len(nrow(cpx) - 1), SIMPLIFY = FALSE))
      if (any(xs > b[["x0"]] - pad & xs < b[["x1"]] + pad & ys > b[["y0"]] - pad & ys < b[["y1"]] + pad))
        stop(sprintf("版面检查失败:%s 与曲线 %s 重叠(按设计应改为只写在图注并回报 B)", nmb, m))
    }
    xs <- seq(dg$x[1], dg$x[2], length.out = 2000); ys <- seq(dg$y[1], dg$y[2], length.out = 2000)
    if (any(xs > b[["x0"]] - pad & xs < b[["x1"]] + pad & ys > b[["y0"]] - pad & ys < b[["y1"]] + pad))
      stop(sprintf("版面检查失败:%s 与对角线重叠", nmb))
  }
  nb <- names(boxes)
  for (i in seq_along(nb)) for (j in seq_len(i - 1)) {
    a <- boxes[[nb[i]]]; b <- boxes[[nb[j]]]
    if (a[["x0"]] < b[["x1"]] && b[["x0"]] < a[["x1"]] && a[["y0"]] < b[["y1"]] && b[["y0"]] < a[["y1"]])
      stop(sprintf("版面检查失败:%s 与 %s 重叠", nb[i], nb[j]))
  }
}

draw <- function(layers) {
  parts <- unlist(lapply(layers, function(l) layer_parts[[l]]()), recursive = FALSE)
  p <- ggplot() + parts +
    scale_x_continuous(breaks = TICKS, labels = sprintf("%.1f", TICKS)) +
    scale_y_continuous(breaks = TICKS, labels = sprintf("%.1f", TICKS)) +
    coord_equal(xlim = c(0, 1), ylim = c(0, 1)) +
    labs(x = paste0("1 ", MINUS, " Specificity"), y = "Sensitivity") +
    theme_fk("axes" %in% layers)
  print(p)
  if (!geom_done && length(layers) == length(LAYERS)) { record_geometry(p); geom_done <<- TRUE }
}

fk_render(draw, LAYERS, canvas = CANVAS, res = RES)
stopifnot(geom_done)

# ---- 其他产出 ----
write_text <- function(path, txt) { con <- file(path, "wb"); on.exit(close(con)); writeBin(charToRaw(enc2utf8(paste0(txt, "\n"))), con) }
dd <- function(id) led(id)$display
# Holm 校正后的陈述只在成立时才写进图注:三个校正 p 都不小于 0.05,写出其中最小者(取自账本)
stopifnot(all(p_holm >= led("design_alpha")$value))
holm_min_id <- paste0("p_holm_", names(PAIRS)[which.min(p_holm)])
caption_en <- sprintf(paste0(
  "ROC curves of three models for angiographic coronary artery disease in the held-out test set, UCI Heart Disease (Cleveland) data. ",
  "The outcome was num > %s (any major vessel with > %s diameter narrowing). ",
  "After excluding %s patients with missing values (complete-case analysis, which assumes that missingness is unrelated to the outcome; ",
  "this assumption cannot be verified with these data), %s patients were randomly split, stratified by outcome, ",
  "into a training set (%s; n = %s) and a test set (%s; n = %s; %s with disease, %s without). ",
  "Models fitted on the training set: simple logistic regression (%s predictors: age, sex, chest pain type), ",
  "full logistic regression (%s predictors) and a random forest (%s predictors; %s trees). ",
  "The legend gives the test-set AUC with %s CI (DeLong method). ",
  "Paired DeLong tests compare the three models (p values unadjusted for %s pairwise comparisons; interpreted descriptively). ",
  "After Holm adjustment for these comparisons, no pair of models differed at the %s level (smallest adjusted p = %s). ",
  "The dashed diagonal indicates chance-level discrimination (AUC %s). ",
  "With a test set of this size, confidence intervals are wide, and results come from a single random split; ",
  "differences between models should be interpreted with caution. ",
  "This figure applies the same class of methods to the public UCI Heart Disease dataset (CC BY %s); ",
  "it does not reproduce the results of any published study. ",
  "The idea of comparing several ROC curves on the same patients with pairwise DeLong tests was taken from a published study; ",
  "that study's figure image was not examined, and the layout of this figure is our own. ",
  "For methodological teaching only; not medical advice."),
  dd("design_outcome_cut"), dd("def_stenosis_pct"), dd("n_excluded"), dd("n_complete"), dd("design_train_frac"), dd("n_train"),
  dd("design_test_frac"), dd("n_test"), dd("n_test_pos"), dd("n_test_neg"), dd("design_n_pred_simple"), dd("design_n_pred_full"),
  dd("design_n_pred_full"), dd("rf_num_trees"), dd("design_ci_level"), dd("design_n_comparisons"), dd("design_alpha"), dd(holm_min_id),
  dd("design_auc_chance"), dd("data_license_version"))
caption_zh <- sprintf(paste0(
  "本图使用公开的 UCI Heart Disease 数据(Cleveland 子集,CC BY %s),运行同类方法,比较三个模型对“冠脉造影显示任一主要血管狭窄超过 %s”的区分能力。",
  "删去 %s 例有缺失值的病例(完整病例分析,假定缺失与结局无关,这一假定无法用本数据验证)后,按结局分层,随机把 %s 例分为训练集(%s)和测试集(%s,%s 例)。",
  "三个模型都只在训练集上拟合,曲线和 AUC 都在测试集上计算:只用年龄、性别、胸痛类型的简单逻辑回归,用全部 %s 个变量的逻辑回归,以及随机森林。",
  "图例中是测试集 AUC 及 %s 置信区间(DeLong 法);三个模型两两之间做配对 DeLong 检验,p 值未作多重比较校正,仅作描述;经 Holm 法校正后,没有一对模型的差异达到 %s 的显著性水平(校正后最小 p = %s)。",
  "测试集只有 %s 例,区间较宽,而且结果只来自一次随机划分,模型之间的差别要谨慎解读。",
  "AUC 只反映区分度,不代表校准好坏或临床是否有用。本图仅为方法学教学,不构成医疗建议;不是对任何已发表研究结果的复现。"),
  dd("data_license_version"), dd("def_stenosis_pct"), dd("n_excluded"), dd("n_complete"), dd("design_train_frac"),
  dd("design_test_frac"), dd("n_test"), dd("design_n_pred_full"), dd("design_ci_level"), dd("design_alpha"), dd(holm_min_id), dd("n_test"))
write_text(fk_out("caption_en.txt"), caption_en)
write_text(fk_out("caption_zh.txt"), caption_zh)
fk_write_json(list(schema = "zzy-media-studio/figure-texts/v1", texts = fig_texts), fk_out("figure_texts.json"))

pred <- data.frame(row_in_file = cc$row_in_file[sp$test], y = y_te, p_lr_simple = fp$test$lr_simple,
                   p_lr_full = fp$test$lr_full, p_rf = fp$test$rf)
con <- file(fk_out("test_predictions.csv"), "wb"); write.csv(pred, con, row.names = FALSE, eol = "\n"); close(con)

fk_finish(list(canvas = CANVAS))
示例数据与下载
| 文件 | 大小 | sha256 |
|---|---|---|
| FIG-0002_v1.1.zip | 1910 KB | 9dbb6e1647cbee74e0bbc0085ca1a11c83d9bc8806a9ddb80ceaa7b537d2514a |
下载包内含代码、示例数据、冻结产出、README、LICENSE、CITATION 与 SHA256SUMS。
出处与如何引用
请先引用原始论文:Jaeckle F, Gillett P, Kirkwood K, Natu S, Chan J, Bateman A, Arends M, Soilleux E. Generalisability of an adult-trained AI model to paediatric coeliac disease diagnosis: a multicentre external validation study. eClinicalMedicine 2026;101. DOI 10.1016/j.eclinm.2026.104246
引用本资源:ZZY的科研图谱. FIG-0002 多模型 ROC 曲线(UCI Heart Disease)(v1.1). 见如何引用。