亚组森林图(Lancet 2021 RECOVERY 托珠单抗 Figure 3)
FIG-0001
原文:RECOVERY Collaborative Group. Tocilizumab in patients admitted to hospital with COVID-19 (RECOVERY): a randomised, controlled, open-label, platform trial. Lancet 2021;397(10285):1637-1645. DOI: 10.1016/S0140-6736(21)00676-0 (PMID 33933206) DOI
这张图在讲什么
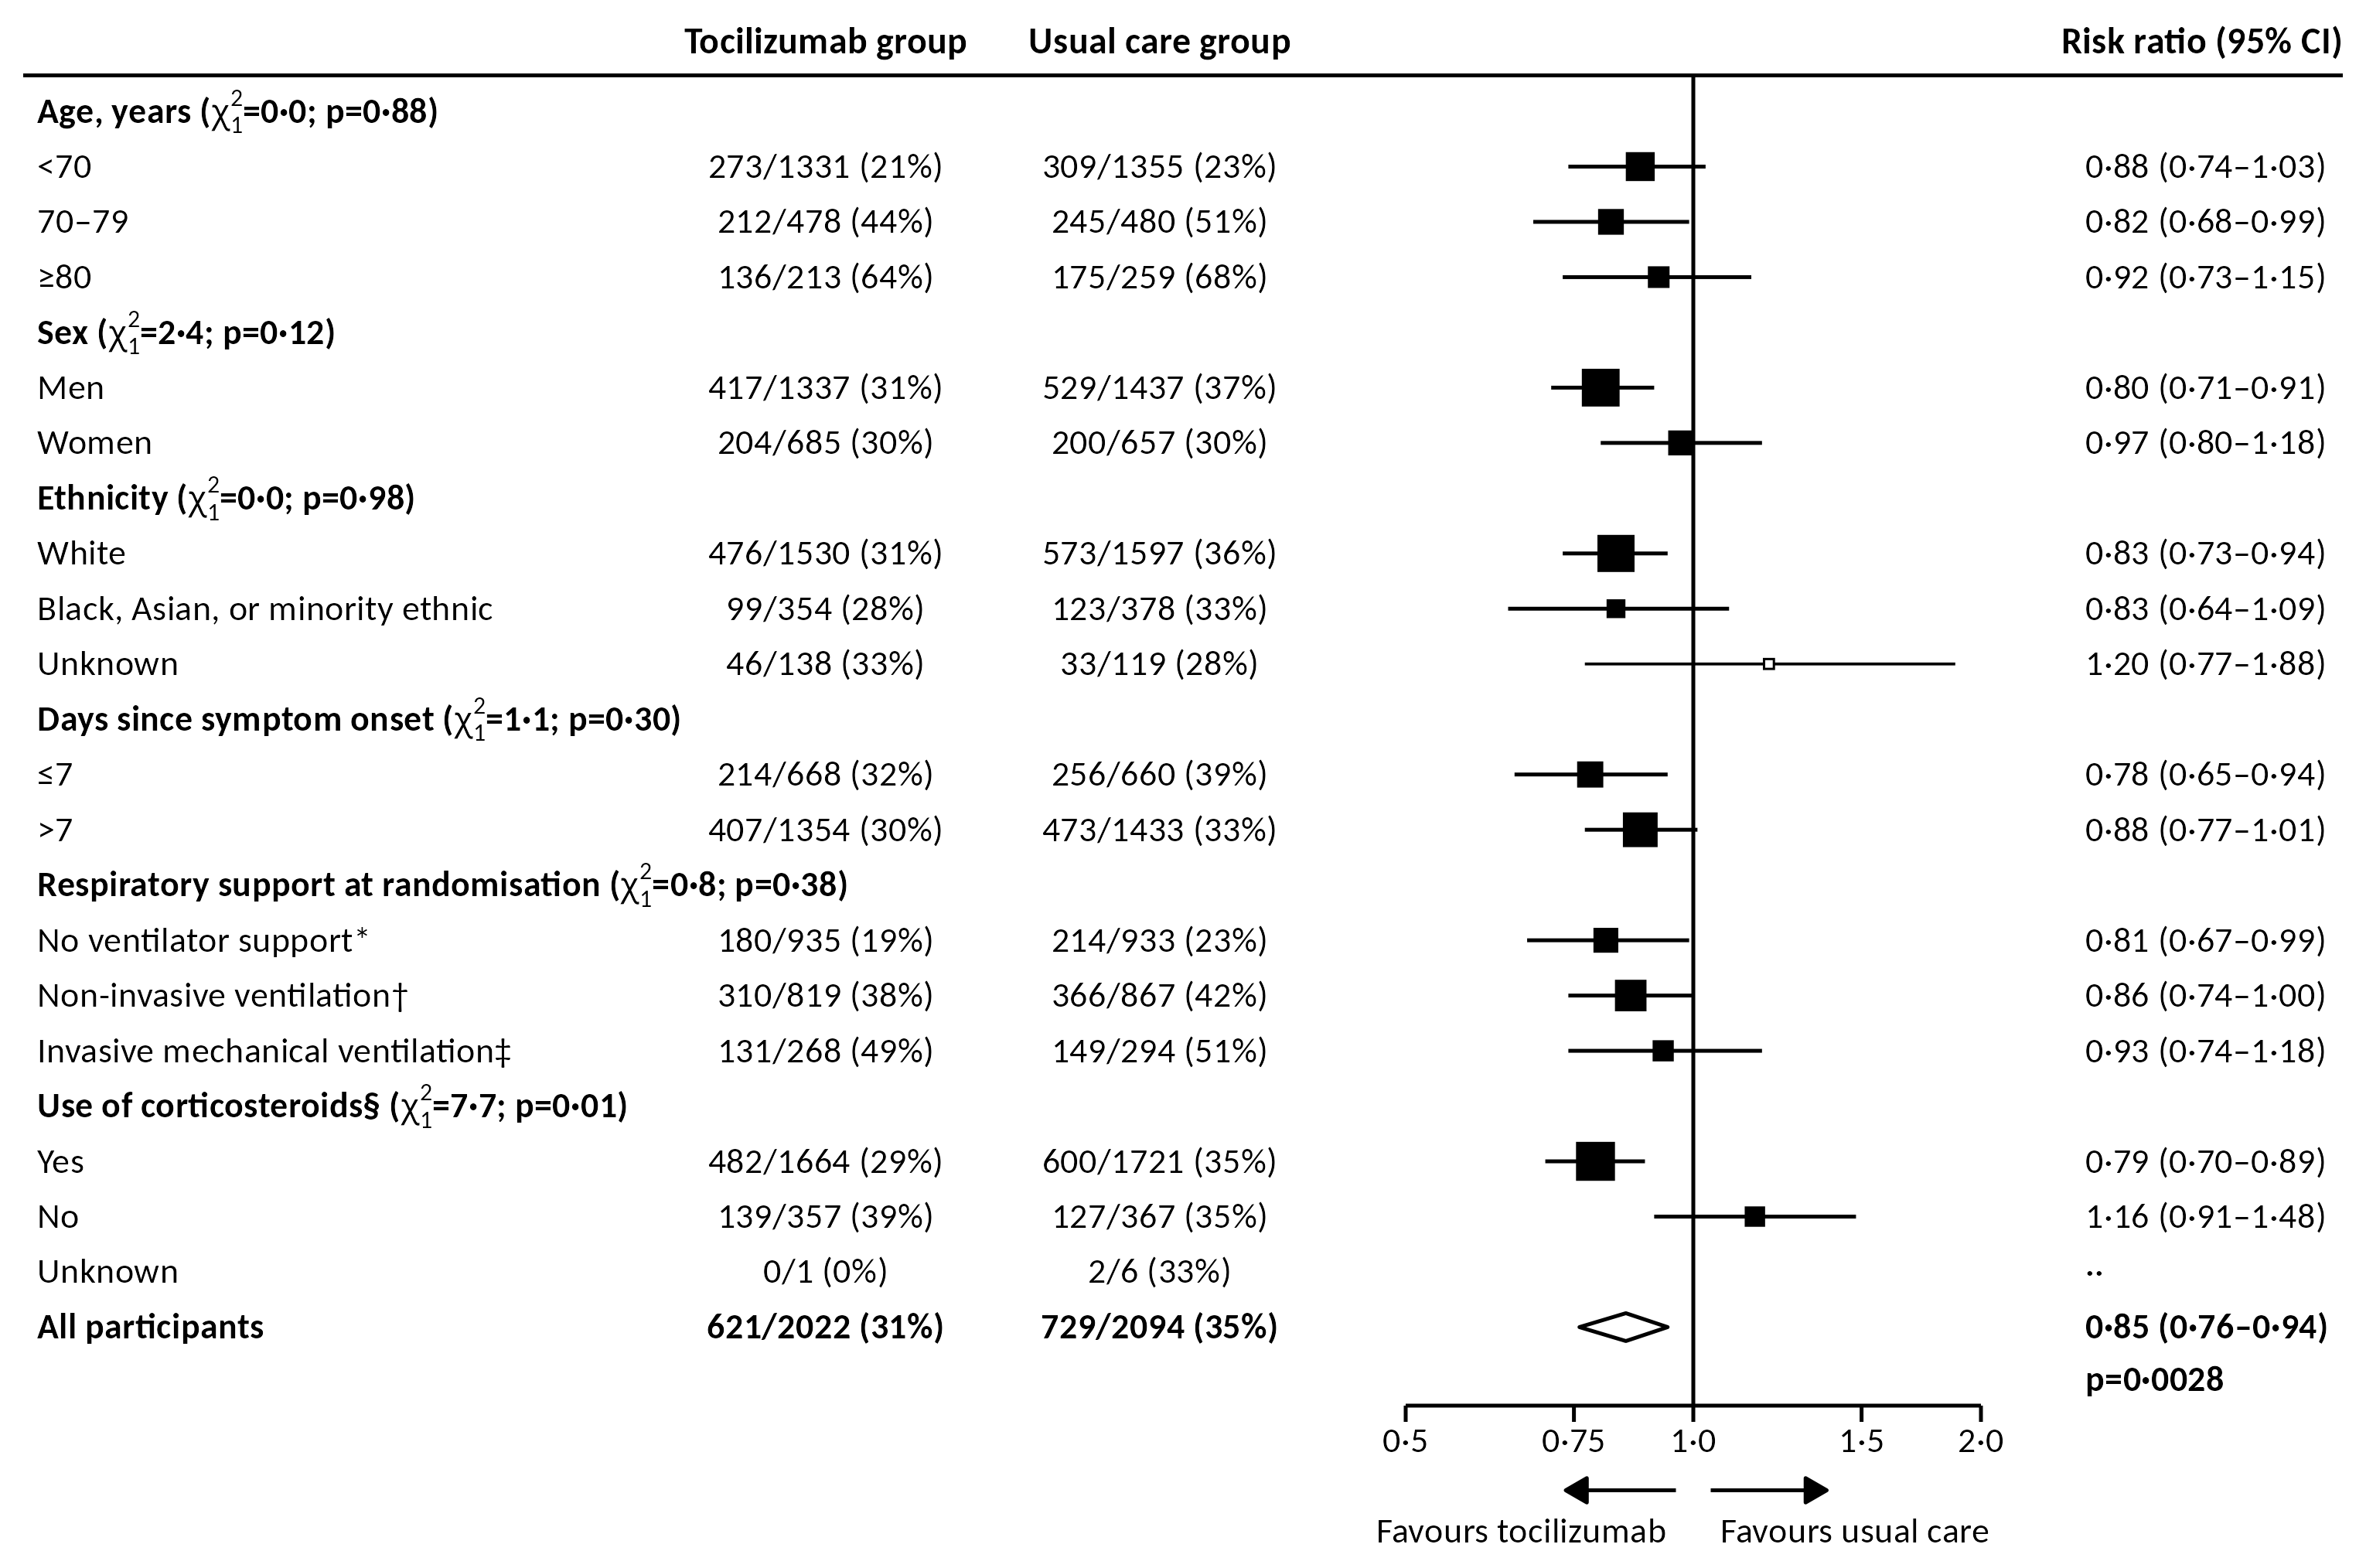
这张亚组森林图重绘自 RECOVERY 托珠单抗随机试验的 Figure 3,展示治疗分配对 28 天死亡的总体比较,以及按不同基线特征划分的亚组结果。
本资源属于 L1+ 发表数值重绘:图中数值取自论文已发表的汇总结果,已逐项核对。这里没有患者级数据,不是重新分析患者记录,也没有重新估计治疗效应或交互检验。
怎么读森林图
- 先对齐行:左侧是各组的事件数、人数和原文百分比,右侧是同一行的比值估计及区间。
- 看方块和横线:方块位置表示点估计,横线表示 95% 置信区间。方块面积编码统计信息量,反映估计的精确程度,不是直接按样本量定大小;本站重绘时由发表区间反推精度,用于视觉编码。
- 看对数横轴:比值以 1·0 为无差异参照。轴采用对数刻度,避免把方向相反、相对幅度相当的比值画成不对称距离。
- 最后看总体菱形:中心是总体估计,左右端点是区间。这些行是同一项试验的亚组,不是不同研究;底部菱形也不是把这些可能重叠的亚组再做一次 Meta 分析。
比值名称要区分。 原图列标题印作 “Risk ratio (95% CI)”,原论文正文和图注称为 rate ratio(率比)。重绘保留原表头,下面按原文称率比,不把它改称 OR 或 HR,也不通过两组百分比直接相除来替代原文估计。
总体行告诉了什么
| 组别 | 死亡事件数 / 人数 | 原文百分比 |
|---|---|---|
| 托珠单抗组 | 621 / 2022 | 31% |
| 常规治疗组 | 729 / 2094 | 35% |
总体行的率比为 0·85,95% 置信区间为 0·76–0·94,原文 p 值为 0·0028。这些是图中 “All participants” 一行的发表结果,方向偏向托珠单抗组;小数中点与精度沿用原文。
图注还列有按基线特征调整的估计,与主图总体行的口径不同,不能混用。本页讲解主图时使用总体行的数值,不把别的分析口径换进来。
亚组分析最容易误读的地方
不能因为一个亚组“显著”、另一个“不显著”,就认定两亚组的效应有差异;也不能仅凭置信区间是否重叠判断交互。 评价亚组间差异要看对应的交互检验,并结合研究设计和不确定性。
例如,年龄分组的交互 p 值为 0·88,没有提供年龄亚组效应不同的明确证据;这不等于已证明所有年龄亚组效应完全相同。是否使用皮质类固醇分组的交互 p 值为 0·01,也不能脱离多次检验和探索性分析的背景,单独据此给出临床用药结论。
原图中 “Use of corticosteroids — Unknown” 行的估计值印作 “··”,表示没有给出该行的比值估计,不是估计值为零。本站保留这种缺失表达,不补造数值。
出处与许可
RECOVERY Collaborative Group. Tocilizumab in patients admitted to hospital with COVID-19 (RECOVERY): a randomised, controlled, open-label, platform trial. 原图与数值见 论文 Figure 3,DOI。本图基于原图发表数值重新绘制,不是原图截图,也不是对原图像素的修改。
原文及本页转录的发表数值采用 CC BY 4.0;使用时请署名并说明重绘。本站代码采用 MIT 许可,教程文字与自制图形采用 CC BY-NC 4.0;软件与字体按各自许可使用,详见下载包的 LICENSE、CITATION、provenance/license.md 和字体许可文件。
本资源仅为方法学教学,不构成医疗建议。
代码
规范实现
code/R/main.R
# FIG-0001 规范实现:Lancet 2021 RECOVERY 托珠单抗 Figure 3(亚组森林图)
# 由 notes/legacy/plot.R 改写。只读 data/,只写 outputs/;数字全部来自 data/,账本与几何由代码生成。
# 运行:python -m tools.figkit run FIG-0001
#
# 坐标:设计坐标沿用 plot.R 的 2000 x 1312 体系(y 向下);四周各留 MARGIN 设计单位的安全边距,
# 画布 = (设计宽高 + 2 x MARGIN) x 1.5 = 3060 x 2028 像素,res = 150。
# 几何信息(geometry.json)一律以画布像素记录(含边距平移)。

source(file.path(Sys.getenv("FIGKIT_LIB"), "figkit.R"))
suppressPackageStartupMessages(library(ggplot2))

FONT <- fk_fonts()                     # FK-Carlito(Calibri 的度量兼容字体)
MIDDOT <- "·"                     # Lancet 的小数点
ENDASH <- "–"                     # 区间连接号

# ---- 版面常量(版面设计,不是数据) ----
W <- 2000; H <- 1312                   # 设计坐标(内容区)
S <- 1.5                               # 设计坐标 -> 画布像素
MARGIN <- 20                           # 四周安全边距(设计单位)= 30 像素,实测文字与线条离边缘均不少于 24 像素
CANVAS <- (c(W, H) + 2 * MARGIN) * S   # 3060 x 2028
RES <- 150
ROW0 <- 76; ROW_H <- 47.65             # 第一行 y 与行距
X_LABEL <- 12; X_TOCI <- 692; X_UC <- 980; X_RR <- 1778
X_MIN <- 0.5; X_MAX <- 2.0; PX0 <- 1192; PX1 <- 1688   # 横轴两端的取值与设计 x
HDR_Y <- 45; AX_Y <- 1192               # 表头横线 y、横轴 y
AX_TOP <- HDR_Y                        # 无效线上端与表头横线相接
FS <- 22.5 / .pt                       # 22.5 pt 正文
LW <- 3.2 / .pt                        # 3.2 pt 线宽
SQ_K <- 1.935                          # 方块边长 = SQ_K / SE(设计坐标;面积 ∝ 1/SE^2,即信息量)
DIAMOND_HALF <- 12                     # 菱形半高

x_of <- function(v) {                  # 对数横轴:0.5 与 2.0 关于 1 对称
  PX0 + (log(v) - log(X_MIN)) / (log(X_MAX) - log(X_MIN)) * (PX1 - PX0)
}
px <- function(v) (v + MARGIN) * S     # 设计坐标 -> 画布像素(含边距平移)
y_of <- function(row_id) ROW0 + (row_id - 1) * ROW_H
dot <- function(s) gsub(".", MIDDOT, s, fixed = TRUE)     # 数据里的 "0.80" -> "0·80"(保留原文小数位)

# ---- 数据 ----
rd <- function(f) read.csv(fk_data(f), colClasses = "character", na.strings = "", fileEncoding = "UTF-8")
d <- rd("forest.csv")
meta <- rd("meta.csv")
num <- function(x) as.numeric(x)
d$row_id <- as.integer(d$row_id)
d$y <- y_of(d$row_id)
stopifnot(identical(d$row_id, seq_len(nrow(d))))
ci_pct <- meta$value[meta$key == "ci_level_pct"]
ticks <- meta$value[startsWith(meta$key, "tick_")]
stopifnot(min(num(ticks)) == X_MIN, max(num(ticks)) == X_MAX)
Z95 <- qnorm(1 - (1 - num(ci_pct) / 100) / 2)          # 由置信水平推导(95% 时 1.959964);只用于方块大小的视觉编码,不进账本

grp <- d[d$kind == "group", ]
rows <- d[d$kind != "group", ]                         # 亚组行 + 总体行
est <- rows[!is.na(rows$est), ]                        # 有估计值的行(含总体)
sub <- est[est$kind == "row", ]
ov <- d[d$kind == "overall", ]

# ---- 数值账本 ----
CI_LEVEL <- sprintf("%s%%(原文 Figure 3 列标题与图注)", ci_pct)
loc <- function(r) sprintf("Figure 3 第 %d 行;data/forest.csv row_id=%d", r$row_id, r$row_id)
for (i in seq_len(nrow(rows))) {
  r <- rows[i, ]
  g <- r$group; lab <- r$label; L <- loc(r)
  add <- function(pre, v, disp, unit) fk_num(paste0(pre, r$slug), num(v), disp, label = lab, group = g, unit = unit,
                                             source_type = "original", locator = L)
  add("ev_t_", r$events_t, r$events_t, "例"); add("n_t_", r$n_t, r$n_t, "人"); add("pct_t_", r$pct_t, paste0(r$pct_t, "%"), "%")
  add("ev_c_", r$events_c, r$events_c, "例"); add("n_c_", r$n_c, r$n_c, "人"); add("pct_c_", r$pct_c, paste0(r$pct_c, "%"), "%")
  if (is.na(r$est)) {
    fk_num(paste0("rr_", r$slug), NA, paste0(MIDDOT, MIDDOT), label = lab, group = g,
           source_type = "original", locator = paste0(L, "(原图印“··”,无估计值)"))
  } else {
    fk_num(paste0("rr_", r$slug), num(r$est), dot(r$est), label = lab, group = g, lo = num(r$lo), hi = num(r$hi),
           ci_level = CI_LEVEL, source_type = "original", locator = L)
    fk_num(paste0("rr_lo_", r$slug), num(r$lo), dot(r$lo), label = paste0(lab, "(区间下限)"), group = g,
           source_type = "original", locator = L)
    fk_num(paste0("rr_hi_", r$slug), num(r$hi), dot(r$hi), label = paste0(lab, "(区间上限)"), group = g,
           source_type = "original", locator = L)
  }
}
for (i in seq_len(nrow(grp))) {
  r <- grp[i, ]; L <- loc(r)
  fk_num(paste0("chi2_", r$slug), num(r$het_stat), dot(r$het_stat), label = paste0(r$label, ":交互检验 χ²(1)"),
         group = r$group, source_type = "original", locator = L)
  fk_num(paste0("p_het_", r$slug), num(r$het_p), dot(r$het_p), label = paste0(r$label, ":交互检验 p"),
         group = r$group, source_type = "original", locator = L)
}
fk_num("p_overall", num(ov$p_value), dot(ov$p_value), label = "All participants:总体效应 p", group = ov$group,
       source_type = "original", locator = sprintf("Figure 3 第 %d 行下方;data/forest.csv row_id=%d", ov$row_id, ov$row_id))
for (t in ticks) {
  fk_num(paste0("tick_", gsub(".", "_", t, fixed = TRUE)), num(t), dot(t), label = "横轴刻度", unit = "风险比",
         source_type = "original", locator = "Figure 3 横轴")
}
fk_num("ci_level", num(ci_pct), paste0(ci_pct, "%"), label = "置信水平", unit = "%",
       source_type = "original", locator = "Figure 3 列标题 “Risk ratio (95% CI)”")

# ---- 几何(画布像素) ----
for (i in seq_len(nrow(d))) {
  r <- d[i, ]
  fk_geom(paste0("rowband_", r$slug), "box", if (r$kind == "group") "groups" else "table",
          x0 = px(0), y0 = px(r$y - ROW_H / 2), x1 = px(W), y1 = px(r$y + ROW_H / 2))
}
for (i in seq_len(nrow(sub))) {
  r <- sub[i, ]
  se <- (log(num(r$hi)) - log(num(r$lo))) / (2 * Z95)
  s <- SQ_K / se
  fk_geom(paste0("ci_", r$slug), "segment", "ci", x1 = px(x_of(num(r$lo))), y1 = px(r$y),
          x2 = px(x_of(num(r$hi))), y2 = px(r$y), num = paste0("rr_", r$slug))
  fk_geom(paste0("sq_", r$slug), "box", "squares", cx = px(x_of(num(r$est))), cy = px(r$y),
          w = s * S, h = s * S, num = paste0("rr_", r$slug))
}
dm <- list(x = x_of(num(c(ov$lo, ov$est, ov$hi, ov$est))), y = ov$y + c(0, -DIAMOND_HALF, 0, DIAMOND_HALF))
fk_geom("diamond_overall", "polygon", "overall", x = px(dm$x), y = px(dm$y), num = "rr_overall")   # 左、上、右、下
fk_geom("null_line", "segment", "refline", x1 = px(x_of(1)), y1 = px(AX_TOP), x2 = px(x_of(1)), y2 = px(AX_Y))
fk_geom("axis_line", "segment", "refline", x1 = px(PX0), y1 = px(AX_Y), x2 = px(PX1), y2 = px(AX_Y))
for (t in ticks) {
  id <- gsub(".", "_", t, fixed = TRUE)
  fk_geom(paste0("tick_", id), "segment", "refline", x1 = px(x_of(num(t))), y1 = px(AX_Y), x2 = px(x_of(num(t))),
          y2 = px(AX_Y + 14), num = paste0("tick_", id))
}

# ---- 图层 ----
# 每个图层只画本层内容;全部叠加 = 整图
counts <- function(e, n, p) sprintf("%s/%s (%s%%)", e, n, p)
rr_txt <- ifelse(is.na(rows$est), paste0(MIDDOT, MIDDOT),
                 sprintf("%s (%s%s%s)", dot(rows$est), dot(rows$lo), ENDASH, dot(rows$hi)))
fw <- ifelse(rows$kind == "overall", "bold", "plain")
grp_expr <- sprintf('bold("%s (")*bold(chi[1]^2)*bold("=%s; p=%s)")', grp$label, dot(grp$het_stat), dot(grp$het_p))
sq <- data.frame(row_id = sub$row_id, y = sub$y, est = num(sub$est), lo = num(sub$lo), hi = num(sub$hi),
                 hollow = sub$hollow == "1")
sq$s <- SQ_K / ((log(sq$hi) - log(sq$lo)) / (2 * Z95))
tk <- num(ticks)
fv_y <- 1265

layer_parts <- list(
  table = function() list(
    annotate("text", x = c(X_TOCI, X_UC), y = 15, label = c("Tocilizumab group", "Usual care group"),
             size = FS * 1.04, family = FONT, fontface = "bold"),
    annotate("text", x = W, y = 15, label = sprintf("Risk ratio (%s%% CI)", ci_pct), hjust = 1,
             size = FS * 1.04, family = FONT, fontface = "bold"),
    annotate("segment", x = 0, xend = W, y = HDR_Y, yend = HDR_Y, linewidth = LW),
    annotate("text", x = X_LABEL, y = rows$y, label = rows$label, hjust = 0, size = FS, family = FONT, fontface = fw),
    annotate("text", x = X_TOCI, y = rows$y, label = counts(rows$events_t, rows$n_t, rows$pct_t), size = FS,
             family = FONT, fontface = fw),
    annotate("text", x = X_UC, y = rows$y, label = counts(rows$events_c, rows$n_c, rows$pct_c), size = FS,
             family = FONT, fontface = fw),
    annotate("text", x = X_RR, y = rows$y, label = rr_txt, hjust = 0, size = FS, family = FONT, fontface = fw)),
  groups = function() list(
    annotate("text", x = X_LABEL, y = grp$y, label = grp_expr, parse = TRUE, hjust = 0, size = FS, family = FONT)),
  refline = function() list(
    annotate("segment", x = x_of(1), xend = x_of(1), y = AX_TOP, yend = AX_Y, linewidth = LW),
    annotate("segment", x = PX0, xend = PX1, y = AX_Y, yend = AX_Y, linewidth = LW),
    annotate("segment", x = x_of(tk), xend = x_of(tk), y = AX_Y, yend = AX_Y + 14, linewidth = LW),
    annotate("text", x = x_of(tk), y = AX_Y + 30, label = dot(ticks), size = FS, family = FONT)),
  ci = function() list(
    annotate("segment", x = x_of(sq$lo), xend = x_of(sq$hi), y = sq$y, yend = sq$y,
             linewidth = ifelse(sq$hollow, LW * 0.75, LW))),
  squares = function() list(
    annotate("rect", xmin = x_of(sq$est) - sq$s / 2, xmax = x_of(sq$est) + sq$s / 2,
             ymin = sq$y - sq$s / 2, ymax = sq$y + sq$s / 2, fill = ifelse(sq$hollow, "white", "black"),
             colour = "black", linewidth = LW * 0.6)),
  overall = function() list(
    annotate("polygon", x = dm$x, y = dm$y, fill = "white", colour = "black", linewidth = LW),
    annotate("text", x = X_RR, y = ov$y + 45, label = sprintf("p=%s", dot(ov$p_value)), hjust = 0, size = FS,
             family = FONT, fontface = "bold")),
  favours = function() list(
    annotate("segment", x = c(1425, 1455), xend = c(1330, 1555), y = fv_y, yend = fv_y, linewidth = LW,
             arrow = arrow(length = unit(0.21, "inches"), type = "closed")),
    annotate("text", x = c(1417, 1463), y = 1300, label = c("Favours tocilizumab", "Favours usual care"),
             hjust = c(1, 0), size = FS, family = FONT))
)
LAYERS <- names(layer_parts)

draw <- function(layers) {
  parts <- unlist(lapply(layers, function(l) layer_parts[[l]]()), recursive = FALSE)
  p <- ggplot() + parts +
    scale_x_continuous(limits = c(-MARGIN, W + MARGIN), expand = c(0, 0)) +
    scale_y_reverse(limits = c(H + MARGIN, -MARGIN), expand = c(0, 0)) +
    theme_void() +
    theme(plot.background = element_blank(), panel.background = element_blank())
  print(p)
}

fk_render(draw, LAYERS, canvas = CANVAS, res = RES)
fk_finish(list(canvas = CANVAS))
移植版
code/py/main.py
"""FIG-0001 移植版(Python / matplotlib):Lancet 2021 RECOVERY 托珠单抗 Figure 3。

由 notes/legacy/forest.py 改写,与 R 规范实现(code/R/main.R)读同一份 data/forest.csv,
并生成与规范实现同格式的 numbers.json、geometry.json,另出一张整图 figure.png 供对照。
规范实现是 R;本文件是移植版,等价性由 tests/port_check.py 检验。

环境变量:FIGKIT_ASSET(资产目录,缺省取本文件上上级)、FIGKIT_FONTS(Carlito 字体目录)、
FIGKIT_PORT_OUT(输出目录)。
"""
import json
import math
import os
from statistics import NormalDist
from pathlib import Path

import matplotlib

matplotlib.use("Agg")
import matplotlib.pyplot as plt  # noqa: E402
import pandas as pd  # noqa: E402
from matplotlib import font_manager  # noqa: E402
from matplotlib.patches import Polygon, Rectangle  # noqa: E402

ASSET = Path(os.environ.get("FIGKIT_ASSET") or Path(__file__).resolve().parents[2])
FONTS = Path(os.environ["FIGKIT_FONTS"])
OUT = Path(os.environ["FIGKIT_PORT_OUT"])
OUT.mkdir(parents=True, exist_ok=True)

MIDDOT, ENDASH = "·", "–"

# ---- 版面常量(与 R 规范实现一致) ----
W, H, S, RES = 2000, 1312, 1.5, 150
MARGIN = 20                   # 四周安全边距(设计单位)= 30 像素
CW, CH = (W + 2 * MARGIN) * S, (H + 2 * MARGIN) * S      # 画布 3060 x 2028
ROW0, ROW_H = 76, 47.65
X_LABEL, X_TOCI, X_UC, X_RR = 12, 692, 980, 1778
X_MIN, X_MAX, PX0, PX1 = 0.5, 2.0, 1192, 1688
HDR_Y, AX_Y = 45, 1192
AX_TOP = HDR_Y                # 无效线上端与表头横线相接
FS_PT = 22.5                  # 正文 22.5 pt
LW_PT = 3.2 * 72 / 96         # R 的 lwd 3.2(1/96 英寸)换算为 matplotlib 的 pt
SQ_K, DIAMOND_HALF = 1.935, 12


def x_of(v):
    return PX0 + (math.log(v) - math.log(X_MIN)) / (math.log(X_MAX) - math.log(X_MIN)) * (PX1 - PX0)


def px(v):
    return (v + MARGIN) * S     # 设计坐标 -> 画布像素(含边距平移)


def dot(s):
    return s.replace(".", MIDDOT)


def num(x):
    return float(x)


def rd(name):
    return pd.read_csv(ASSET / "data" / name, dtype=str, keep_default_na=False, encoding="utf-8")


d = rd("forest.csv")
meta = rd("meta.csv")
d["row_id"] = d["row_id"].astype(int)
d["y"] = ROW0 + (d["row_id"] - 1) * ROW_H
ci_pct = meta.loc[meta.key == "ci_level_pct", "value"].iloc[0]
ticks = list(meta.loc[meta.key.str.startswith("tick_"), "value"])
assert min(map(float, ticks)) == X_MIN and max(map(float, ticks)) == X_MAX
Z95 = NormalDist().inv_cdf(1 - (1 - float(ci_pct) / 100) / 2)      # 由置信水平推导(95% 时 1.959964)

grp = d[d.kind == "group"]
rows = d[d.kind != "group"]
sub = rows[(rows.kind == "row") & (rows.est != "")]
ov = d[d.kind == "overall"].iloc[0]

# ---- 数值账本 ----
ledger = []


def fk_num(id, value, display, label=None, group=None, lo=None, hi=None, ci_level=None, unit=None,
           source_type="original", locator=None):
    rec = {"id": id, "group": group, "label": label, "value": value, "lo": lo, "hi": hi,
           "ci_level": ci_level, "display": display, "unit": unit,
           "source": {"type": source_type, "locator": locator}}
    ledger.append({k: v for k, v in rec.items() if v is not None})


CI_LEVEL = f"{ci_pct}%(原文 Figure 3 列标题与图注)"
for _, r in rows.iterrows():
    L = f"Figure 3 第 {r.row_id} 行;data/forest.csv row_id={r.row_id}"
    kw = dict(label=r.label, group=r.group, source_type="original", locator=L)
    fk_num("ev_t_" + r.slug, num(r.events_t), r.events_t, unit="例", **kw)
    fk_num("n_t_" + r.slug, num(r.n_t), r.n_t, unit="人", **kw)
    fk_num("pct_t_" + r.slug, num(r.pct_t), r.pct_t + "%", unit="%", **kw)
    fk_num("ev_c_" + r.slug, num(r.events_c), r.events_c, unit="例", **kw)
    fk_num("n_c_" + r.slug, num(r.n_c), r.n_c, unit="人", **kw)
    fk_num("pct_c_" + r.slug, num(r.pct_c), r.pct_c + "%", unit="%", **kw)
    if r.est == "":
        fk_num("rr_" + r.slug, None, MIDDOT + MIDDOT, label=r.label, group=r.group, source_type="original",
               locator=L + "(原图印“··”,无估计值)")
    else:
        fk_num("rr_" + r.slug, num(r.est), dot(r.est), label=r.label, group=r.group, lo=num(r.lo), hi=num(r.hi),
               ci_level=CI_LEVEL, source_type="original", locator=L)
        fk_num("rr_lo_" + r.slug, num(r.lo), dot(r.lo), label=r.label + "(区间下限)", group=r.group,
               source_type="original", locator=L)
        fk_num("rr_hi_" + r.slug, num(r.hi), dot(r.hi), label=r.label + "(区间上限)", group=r.group,
               source_type="original", locator=L)
for _, r in grp.iterrows():
    L = f"Figure 3 第 {r.row_id} 行;data/forest.csv row_id={r.row_id}"
    fk_num("chi2_" + r.slug, num(r.het_stat), dot(r.het_stat), label=r.label + ":交互检验 χ²(1)", group=r.group,
           source_type="original", locator=L)
    fk_num("p_het_" + r.slug, num(r.het_p), dot(r.het_p), label=r.label + ":交互检验 p", group=r.group,
           source_type="original", locator=L)
fk_num("p_overall", num(ov.p_value), dot(ov.p_value), label="All participants:总体效应 p", group=ov.group,
       source_type="original", locator=f"Figure 3 第 {ov.row_id} 行下方;data/forest.csv row_id={ov.row_id}")
for t in ticks:
    fk_num("tick_" + t.replace(".", "_"), num(t), dot(t), label="横轴刻度", unit="风险比",
           source_type="original", locator="Figure 3 横轴")
fk_num("ci_level", num(ci_pct), ci_pct + "%", label="置信水平", unit="%", source_type="original",
       locator="Figure 3 列标题 “Risk ratio (95% CI)”")

# ---- 几何(画布像素) ----
geometry = []


def fk_geom(id, kind, layer, num=None, **coords):
    rec = {"id": id, "kind": kind, "layer": layer}
    rec.update({k: ([round(float(x), 3) for x in v] if isinstance(v, (list, tuple)) else round(float(v), 3))
                for k, v in coords.items()})
    if num is not None:
        rec["num"] = num
    geometry.append(rec)


def square_side(r):
    se = (math.log(num(r.hi)) - math.log(num(r.lo))) / (2 * Z95)
    return SQ_K / se


for _, r in d.iterrows():
    fk_geom("rowband_" + r.slug, "box", "groups" if r.kind == "group" else "table",
            x0=px(0), y0=px(r.y - ROW_H / 2), x1=px(W), y1=px(r.y + ROW_H / 2))
for _, r in sub.iterrows():
    s = square_side(r)
    fk_geom("ci_" + r.slug, "segment", "ci", num="rr_" + r.slug, x1=px(x_of(num(r.lo))), y1=px(r.y),
            x2=px(x_of(num(r.hi))), y2=px(r.y))
    fk_geom("sq_" + r.slug, "box", "squares", num="rr_" + r.slug, cx=px(x_of(num(r.est))), cy=px(r.y),
            w=s * S, h=s * S)
dm_x = [x_of(num(v)) for v in (ov.lo, ov.est, ov.hi, ov.est)]
dm_y = [ov.y + o for o in (0, -DIAMOND_HALF, 0, DIAMOND_HALF)]
fk_geom("diamond_overall", "polygon", "overall", num="rr_overall", x=[px(v) for v in dm_x], y=[px(v) for v in dm_y])
fk_geom("null_line", "segment", "refline", x1=px(x_of(1)), y1=px(AX_TOP), x2=px(x_of(1)), y2=px(AX_Y))
fk_geom("axis_line", "segment", "refline", x1=px(PX0), y1=px(AX_Y), x2=px(PX1), y2=px(AX_Y))
for t in ticks:
    fk_geom("tick_" + t.replace(".", "_"), "segment", "refline", num="tick_" + t.replace(".", "_"),
            x1=px(x_of(num(t))), y1=px(AX_Y), x2=px(x_of(num(t))), y2=px(AX_Y + 14))


def write_json(obj, name):
    (OUT / name).write_text(json.dumps(obj, ensure_ascii=False, indent=1) + "\n", encoding="utf-8", newline="\n")


write_json({"schema": "zzy-media-studio/numbers/v1", "asset": ASSET.name, "numbers": ledger}, "numbers.json")
write_json({"schema": "zzy-media-studio/geometry/v1", "origin": "top-left", "unit": "px",
            "canvas": [int(round(CW)), int(round(CH))], "elements": geometry}, "geometry.json")

# ---- 整图(对照用;字体只用 FIGKIT_FONTS 下的 Carlito) ----
for f in ("Carlito-Regular.ttf", "Carlito-Bold.ttf", "Carlito-Italic.ttf", "Carlito-BoldItalic.ttf"):
    font_manager.fontManager.addfont(str(FONTS / f))
plt.rcParams.update({"font.family": "Carlito", "mathtext.fontset": "custom", "mathtext.rm": "Carlito",
                     "mathtext.it": "Carlito:italic", "mathtext.bf": "Carlito:bold"})

fig = plt.figure(figsize=(CW / RES, CH / RES), dpi=RES)
ax = fig.add_axes([0, 0, 1, 1])
ax.set_xlim(-MARGIN, W + MARGIN)
ax.set_ylim(H + MARGIN, -MARGIN)
ax.axis("off")
T = dict(fontsize=FS_PT, va="center", color="black")


def line(x1, y1, x2, y2, lw=LW_PT, **kw):
    ax.plot([x1, x2], [y1, y2], color="black", lw=lw, solid_capstyle="butt", **kw)


ax.text(X_TOCI, 15, "Tocilizumab group", ha="center", fontsize=FS_PT * 1.04, va="center", fontweight="bold")
ax.text(X_UC, 15, "Usual care group", ha="center", fontsize=FS_PT * 1.04, va="center", fontweight="bold")
ax.text(W, 15, f"Risk ratio ({ci_pct}% CI)", ha="right", fontsize=FS_PT * 1.04, va="center",
        fontweight="bold")
line(0, HDR_Y, W, HDR_Y)
for _, r in d.iterrows():
    if r.kind == "group":
        ax.text(X_LABEL, r.y, rf"{r.label} ($\chi^2_1$={dot(r.het_stat)}; p={dot(r.het_p)})", fontweight="bold", **T)
        continue
    fw = "bold" if r.kind == "overall" else "normal"
    ax.text(X_LABEL, r.y, r.label, fontweight=fw, **T)
    ax.text(X_TOCI, r.y, f"{r.events_t}/{r.n_t} ({r.pct_t}%)", ha="center", fontweight=fw, **T)
    ax.text(X_UC, r.y, f"{r.events_c}/{r.n_c} ({r.pct_c}%)", ha="center", fontweight=fw, **T)
    txt = MIDDOT * 2 if r.est == "" else f"{dot(r.est)} ({dot(r.lo)}{ENDASH}{dot(r.hi)})"
    ax.text(X_RR, r.y, txt, fontweight=fw, **T)
line(x_of(1), AX_TOP, x_of(1), AX_Y)
line(PX0, AX_Y, PX1, AX_Y)
for t in ticks:
    line(x_of(num(t)), AX_Y, x_of(num(t)), AX_Y + 14)
    ax.text(x_of(num(t)), AX_Y + 30, dot(t), ha="center", **T)
for _, r in sub.iterrows():
    hollow = r.hollow == "1"
    line(x_of(num(r.lo)), r.y, x_of(num(r.hi)), r.y, lw=LW_PT * (0.75 if hollow else 1), zorder=2)
    s = square_side(r)
    ax.add_patch(Rectangle((x_of(num(r.est)) - s / 2, r.y - s / 2), s, s, facecolor="white" if hollow else "black",
                           edgecolor="black", lw=LW_PT * 0.6, zorder=3))
ax.add_patch(Polygon(list(zip(dm_x, dm_y)), closed=True, facecolor="white", edgecolor="black", lw=LW_PT, zorder=3))
ax.text(X_RR, ov.y + 45, f"p={dot(ov.p_value)}", fontweight="bold", **T)
for x0, x1, label, ha, tx in [(1425, 1330, "Favours tocilizumab", "right", 1417),
                              (1455, 1555, "Favours usual care", "left", 1463)]:
    ax.annotate("", xy=(x1, 1265), xytext=(x0, 1265),
                arrowprops=dict(arrowstyle="-|>,head_length=1.5,head_width=0.86", color="black",
                                lw=LW_PT, shrinkA=0, shrinkB=0))
    ax.text(tx, 1300, label, ha=ha, **T)
fig.savefig(OUT / "figure.png", dpi=RES, facecolor="white")
plt.close(fig)
print("port done:", OUT)
示例数据与下载
| 文件 | 大小 | sha256 |
|---|---|---|
| FIG-0001_v1.0.zip | 2089 KB | e08b25be4ff6ed011cfcda874d665a2426574b0e10dd03eb04ed20c7ad5f668c |
下载包内含代码、示例数据、冻结产出、README、LICENSE、CITATION 与 SHA256SUMS。
出处与如何引用
请先引用原始论文:RECOVERY Collaborative Group. Tocilizumab in patients admitted to hospital with COVID-19 (RECOVERY): a randomised, controlled, open-label, platform trial. Lancet 2021;397(10285):1637-1645. DOI: 10.1016/S0140-6736(21)00676-0 (PMID 33933206)
引用本资源:ZZY的科研图谱. FIG-0001 亚组森林图(Lancet 2021 RECOVERY 托珠单抗 Figure 3)(v1.0). 见如何引用。